29
/
en
AIzaSyAYiBZKx7MnpbEhh9jyipgxe19OcubqV5w
April 1, 2024
190247
Mali
MLI
true
2
1
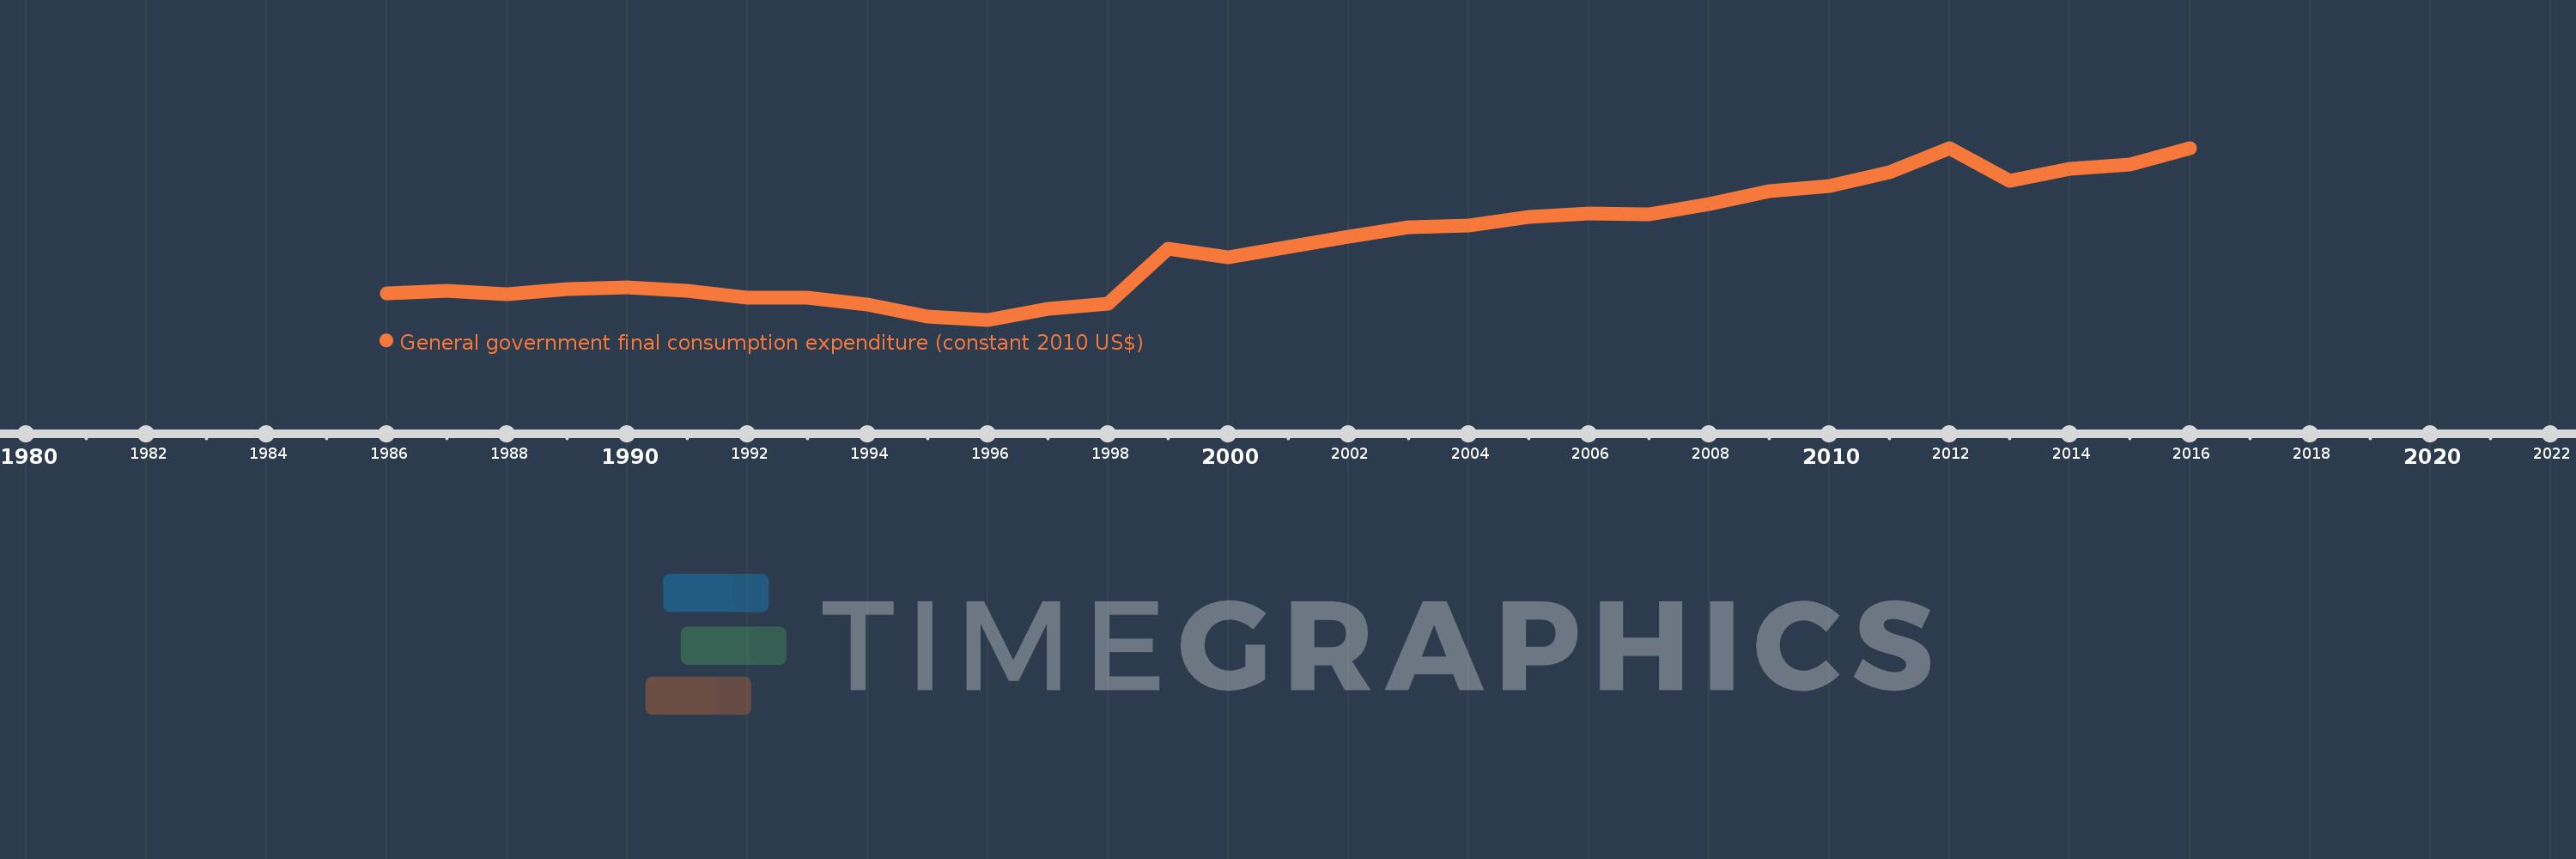
General government final consumption expenditure (constant 2010 US$)
2016,2015,2014,2013,2012,2011,2010,2009,2008,2007,2006,2005,2004,2003,2002,2001,2000,1999,1998,1997,1996,1995,1994,1993,1992,1991,1990,1989,1988,1987,1986
This statistics in other country:
AfghanistanAlbaniaAlgeriaAngolaAntigua and BarbudaArab WorldArgentinaArmeniaArubaAustraliaAustriaAzerbaijanBahamas, TheBahrainBangladeshBarbadosBelarusBelgiumBelizeBeninBermudaBhutanBoliviaBosnia and HerzegovinaBotswanaBrazilBrunei DarussalamBulgariaBurkina FasoBurundiCabo VerdeCambodiaCameroonCanadaCaribbean small statesCentral African RepublicCentral Europe and the BalticsChadChileChinaColombiaComorosCongo, Dem. Rep.Congo, Rep.Costa RicaCote d'IvoireCroatiaCubaCyprusCzech RepublicDenmarkDominicaDominican RepublicEarly-demographic dividendEast Asia & PacificEast Asia & Pacific (excluding high income)East Asia & Pacific (IDA & IBRD countries)EcuadorEgypt, Arab Rep.El SalvadorEquatorial GuineaEritreaEstoniaEuro areaEurope & Central AsiaEurope & Central Asia (excluding high income)Europe & Central Asia (IDA & IBRD countries)European UnionFaroe IslandsFinlandFragile and conflict affected situationsFranceGabonGambia, TheGeorgiaGermanyGhanaGreeceGrenadaGuatemalaGuineaGuinea-BissauGuyanaHaitiHeavily indebted poor countries (HIPC)High incomeHondurasHong Kong SAR, ChinaHungaryIBRD onlyIcelandIDA & IBRD totalIDA blendIDA onlyIDA totalIndiaIndonesiaIran, Islamic Rep.IraqIrelandIsraelItalyJamaicaJapanJordanKazakhstanKenyaKorea, Rep.KosovoKuwaitKyrgyz RepublicLao PDRLate-demographic dividendLatin America & Caribbean Latin America & Caribbean (excluding high income)Latin America & the Caribbean (IDA & IBRD countries)LatviaLeast developed countries: UN classificationLebanonLiberiaLithuaniaLow & middle incomeLow incomeLower middle incomeLuxembourgMacao SAR, ChinaMacedonia, FYRMadagascarMalawiMalaysiaMaliMaltaMauritaniaMauritiusMexicoMiddle East & North AfricaMiddle East & North Africa (excluding high income)Middle East & North Africa (IDA & IBRD countries)Middle incomeMoldovaMongoliaMontenegroMoroccoMozambiqueNamibiaNepalNetherlandsNew ZealandNicaraguaNigerNigeriaNorth AmericaNorwayOECD membersOmanOther small statesPakistanPanamaParaguayPeruPhilippinesPolandPortugalPost-demographic dividendPre-demographic dividendPuerto RicoQatarRomaniaRussian FederationRwandaSaudi ArabiaSenegalSerbiaSeychellesSierra LeoneSingaporeSlovak RepublicSloveniaSmall statesSouth AfricaSouth AsiaSouth Asia (IDA & IBRD)South SudanSpainSri LankaSt. Kitts and NevisSt. LuciaSt. Vincent and the GrenadinesSub-Saharan Africa Sub-Saharan Africa (excluding high income)Sub-Saharan Africa (IDA & IBRD countries)SudanSurinameSwazilandSwedenSwitzerlandTajikistanTanzaniaThailandTimor-LesteTogoTongaTrinidad and TobagoTunisiaTurkeyTurkmenistanUgandaUkraineUnited Arab EmiratesUnited KingdomUnited StatesUpper middle incomeUruguayUzbekistanVanuatuVenezuela, RBVietnamWest Bank and GazaWorldYemen, Rep.ZambiaZimbabwe Timeline:
This timeline shows a graph from 1986 to 2016 of Mali. No data until 1985. Number of actual observations by date: 31.
Source name:
World Development Indicators
Source organization:
World Bank national accounts data, and OECD National Accounts data files.
Categories, topics:
Economy & Growth
Last updated:
apr 23, 2017
Indicators value changes by year
Minimum:
429.139 mln
jan 1, 1996
Maximum:
1.883 bln
jan 1, 2016
At the date of observation
Value
Absolute change
Change from previous value
jan 1, 1986
654.785 mln
+654.785 mln
0.0%
jan 1, 1987
674.635 mln
+19.85 mln
3.03%
jan 1, 1988
644.07 mln
-30.565 mln
-4.53%
jan 1, 1989
688.639 mln
+44.568 mln
6.92%
jan 1, 1990
703.14 mln
+14.501 mln
2.11%
jan 1, 1991
671.368 mln
-31.772 mln
-4.52%
jan 1, 1992
619.448 mln
-51.921 mln
-7.73%
jan 1, 1993
616.8 mln
-2.648 mln
-0.43%
jan 1, 1994
559.959 mln
-56.841 mln
-9.22%
jan 1, 1995
457.22 mln
-102.739 mln
-18.35%
jan 1, 1996
429.139 mln
-28.081 mln
-6.14%
jan 1, 1997
519.22 mln
+90.081 mln
20.99%
jan 1, 1998
564.719 mln
+45.499 mln
8.76%
jan 1, 1999
1.031 bln
+466.231 mln
82.56%
jan 1, 2000
957.728 mln
-73.222 mln
-7.1%
jan 1, 2001
1.047 bln
+89.56 mln
9.35%
jan 1, 2002
1.131 bln
+83.531 mln
7.98%
jan 1, 2003
1.21 bln
+78.779 mln
6.97%
jan 1, 2004
1.223 bln
+13.483 mln
1.11%
jan 1, 2005
1.299 bln
+75.693 mln
6.19%
jan 1, 2006
1.328 bln
+29.081 mln
2.24%
jan 1, 2007
1.321 bln
-6.556 mln
-0.49%
jan 1, 2008
1.408 bln
+86.32 mln
6.53%
jan 1, 2009
1.518 bln
+110.009 mln
7.82%
jan 1, 2010
1.56 bln
+41.952 mln
2.76%
jan 1, 2011
1.675 bln
+115.666 mln
7.42%
jan 1, 2012
1.88 bln
+204.443 mln
12.2%
jan 1, 2013
1.607 bln
-272.245 mln
-14.48%
jan 1, 2014
1.708 bln
+100.297 mln
6.24%
jan 1, 2015
1.741 bln
+33.727 mln
1.97%
jan 1, 2016
1.883 bln
+141.185 mln
8.11%
Ranking of countries by current statistics by years


Comments: