29
/
en
AIzaSyAYiBZKx7MnpbEhh9jyipgxe19OcubqV5w
April 1, 2024
85799
Bhutan
BTN
true
2
1
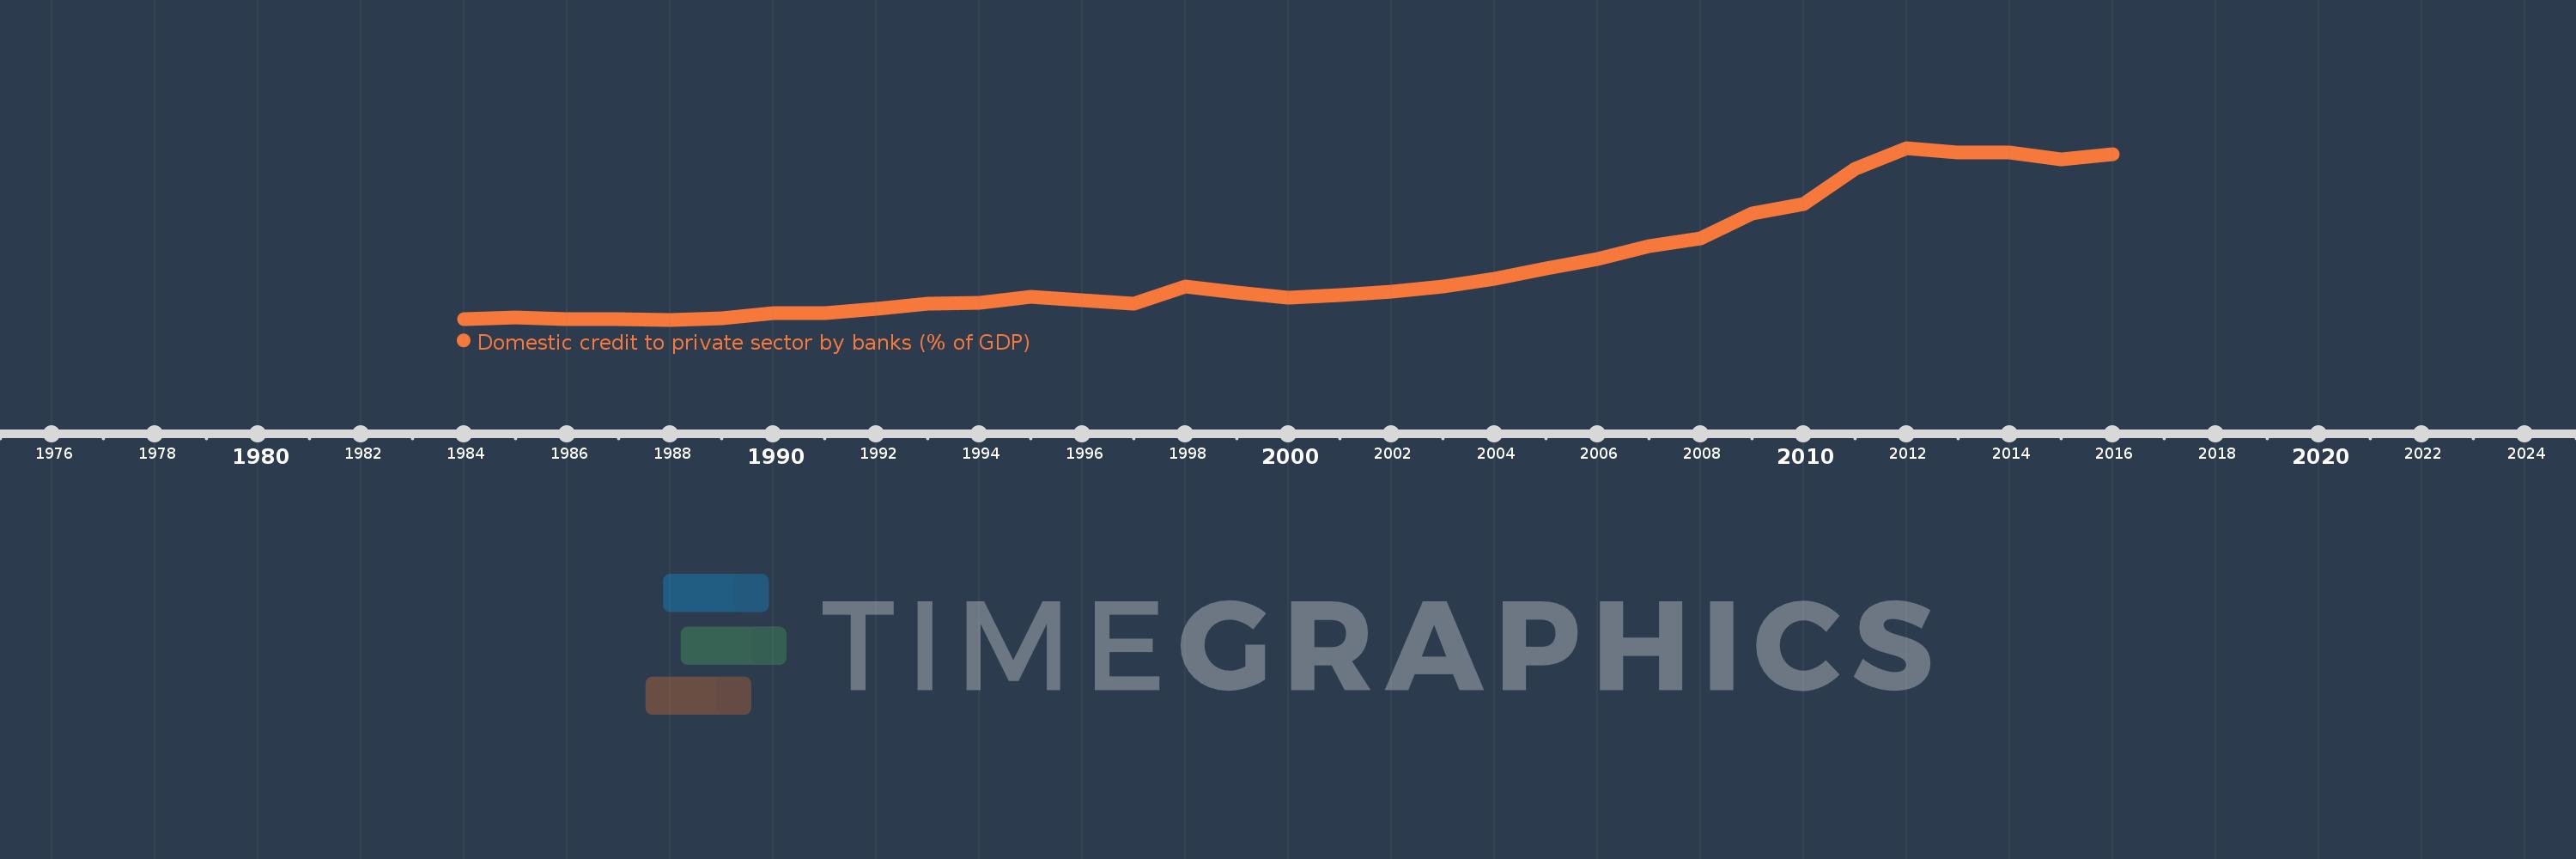
Domestic credit to private sector by banks (% of GDP)
2016,2015,2014,2013,2012,2011,2010,2009,2008,2007,2006,2005,2004,2003,2002,2001,2000,1999,1998,1997,1996,1995,1994,1993,1992,1991,1990,1989,1988,1987,1986,1985,1984
This statistics in other country:
AfghanistanAlbaniaAlgeriaAngolaAntigua and BarbudaArab WorldArgentinaArmeniaArubaAustraliaAustriaAzerbaijanBahamas, TheBahrainBangladeshBarbadosBelarusBelgiumBelizeBeninBhutanBoliviaBosnia and HerzegovinaBotswanaBrazilBrunei DarussalamBulgariaBurkina FasoBurundiCabo VerdeCambodiaCameroonCanadaCaribbean small statesCentral African RepublicCentral Europe and the BalticsChadChileChinaColombiaComorosCongo, Dem. Rep.Congo, Rep.Costa RicaCote d'IvoireCroatiaCyprusCzech RepublicDenmarkDjiboutiDominicaDominican RepublicEarly-demographic dividendEast Asia & PacificEast Asia & Pacific (excluding high income)East Asia & Pacific (IDA & IBRD countries)EcuadorEgypt, Arab Rep.El SalvadorEquatorial GuineaEritreaEstoniaEthiopiaEuro areaEurope & Central AsiaEurope & Central Asia (excluding high income)Europe & Central Asia (IDA & IBRD countries)European UnionFijiFinlandFragile and conflict affected situationsFranceGabonGambia, TheGeorgiaGermanyGhanaGreeceGrenadaGuatemalaGuineaGuinea-BissauGuyanaHaitiHeavily indebted poor countries (HIPC)High incomeHondurasHong Kong SAR, ChinaHungaryIBRD onlyIcelandIDA & IBRD totalIDA blendIDA onlyIDA totalIndiaIndonesiaIran, Islamic Rep.IraqIrelandIsraelItalyJamaicaJapanJordanKazakhstanKenyaKorea, Rep.KosovoKuwaitKyrgyz RepublicLao PDRLate-demographic dividendLatin America & Caribbean Latin America & Caribbean (excluding high income)Latin America & the Caribbean (IDA & IBRD countries)LatviaLeast developed countries: UN classificationLebanonLesothoLiberiaLibyaLithuaniaLow & middle incomeLow incomeLower middle incomeLuxembourgMacao SAR, ChinaMacedonia, FYRMadagascarMalawiMalaysiaMaldivesMaliMaltaMauritaniaMauritiusMexicoMicronesia, Fed. Sts.Middle East & North AfricaMiddle East & North Africa (excluding high income)Middle East & North Africa (IDA & IBRD countries)Middle incomeMoldovaMongoliaMontenegroMoroccoMozambiqueMyanmarNamibiaNepalNetherlandsNew ZealandNicaraguaNigerNigeriaNorth AmericaNorwayOECD membersOmanOther small statesPacific island small statesPakistanPanamaPapua New GuineaParaguayPeruPhilippinesPolandPortugalPost-demographic dividendPre-demographic dividendQatarRomaniaRussian FederationRwandaSamoaSao Tome and PrincipeSaudi ArabiaSenegalSerbiaSeychellesSierra LeoneSingaporeSlovak RepublicSloveniaSmall statesSolomon IslandsSouth AfricaSouth AsiaSouth Asia (IDA & IBRD)South SudanSpainSri LankaSt. Kitts and NevisSt. LuciaSt. Vincent and the GrenadinesSub-Saharan Africa Sub-Saharan Africa (excluding high income)Sub-Saharan Africa (IDA & IBRD countries)SudanSurinameSwazilandSwedenSwitzerlandSyrian Arab RepublicTajikistanTanzaniaThailandTimor-LesteTogoTongaTrinidad and TobagoTunisiaTurkeyUgandaUkraineUnited Arab EmiratesUnited KingdomUnited StatesUpper middle incomeUruguayVanuatuVenezuela, RBVietnamWest Bank and GazaWorldYemen, Rep.ZambiaZimbabwe Timeline:
This timeline shows a graph from 1984 to 2016 of Bhutan. No data until 1983. Number of actual observations by date: 33.
Source name:
World Development Indicators
Source organization:
International Monetary Fund, International Financial Statistics and data files, and World Bank and OECD GDP estimates.
Categories, topics:
Financial Sector
Last updated:
apr 23, 2017
Indicators value changes by year
Maximum:
46.787
jan 1, 2012
At the date of observation
Value
Absolute change
Change from previous value
jan 1, 1984
2.577
+2.577
0.0%
jan 1, 1985
3.006
+0.429
16.64%
jan 1, 1986
2.601
-0.405
-13.49%
jan 1, 1987
2.65
+0.05
1.91%
jan 1, 1988
2.508
-0.142
-5.36%
jan 1, 1989
2.933
+0.425
16.95%
jan 1, 1990
4.291
+1.358
46.3%
jan 1, 1991
4.113
-0.179
-4.16%
jan 1, 1992
5.383
+1.27
30.89%
jan 1, 1993
6.549
+1.165
21.65%
jan 1, 1994
6.815
+0.266
4.07%
jan 1, 1995
8.521
+1.706
25.04%
jan 1, 1996
7.638
-0.883
-10.36%
jan 1, 1997
6.675
-0.963
-12.61%
jan 1, 1998
11.081
+4.405
66.0%
jan 1, 1999
9.466
-1.614
-14.57%
jan 1, 2000
8.258
-1.208
-12.76%
jan 1, 2001
8.854
+0.596
7.22%
jan 1, 2002
9.773
+0.919
10.38%
jan 1, 2003
11.105
+1.331
13.62%
jan 1, 2004
12.978
+1.873
16.87%
jan 1, 2005
15.813
+2.835
21.85%
jan 1, 2006
18.069
+2.256
14.27%
jan 1, 2007
21.385
+3.317
18.36%
jan 1, 2008
23.398
+2.012
9.41%
jan 1, 2009
29.931
+6.533
27.92%
jan 1, 2010
32.395
+2.464
8.23%
jan 1, 2011
41.422
+9.027
27.87%
jan 1, 2012
46.787
+5.365
12.95%
jan 1, 2013
45.699
-1.087
-2.32%
jan 1, 2014
45.625
-0.075
-0.16%
jan 1, 2015
43.803
-1.822
-3.99%
jan 1, 2016
45.182
+1.379
3.15%
Ranking of countries by current statistics by years


Comments: