29
/
en
AIzaSyAYiBZKx7MnpbEhh9jyipgxe19OcubqV5w
April 1, 2024
264460
Togo
TGO
true
2
1
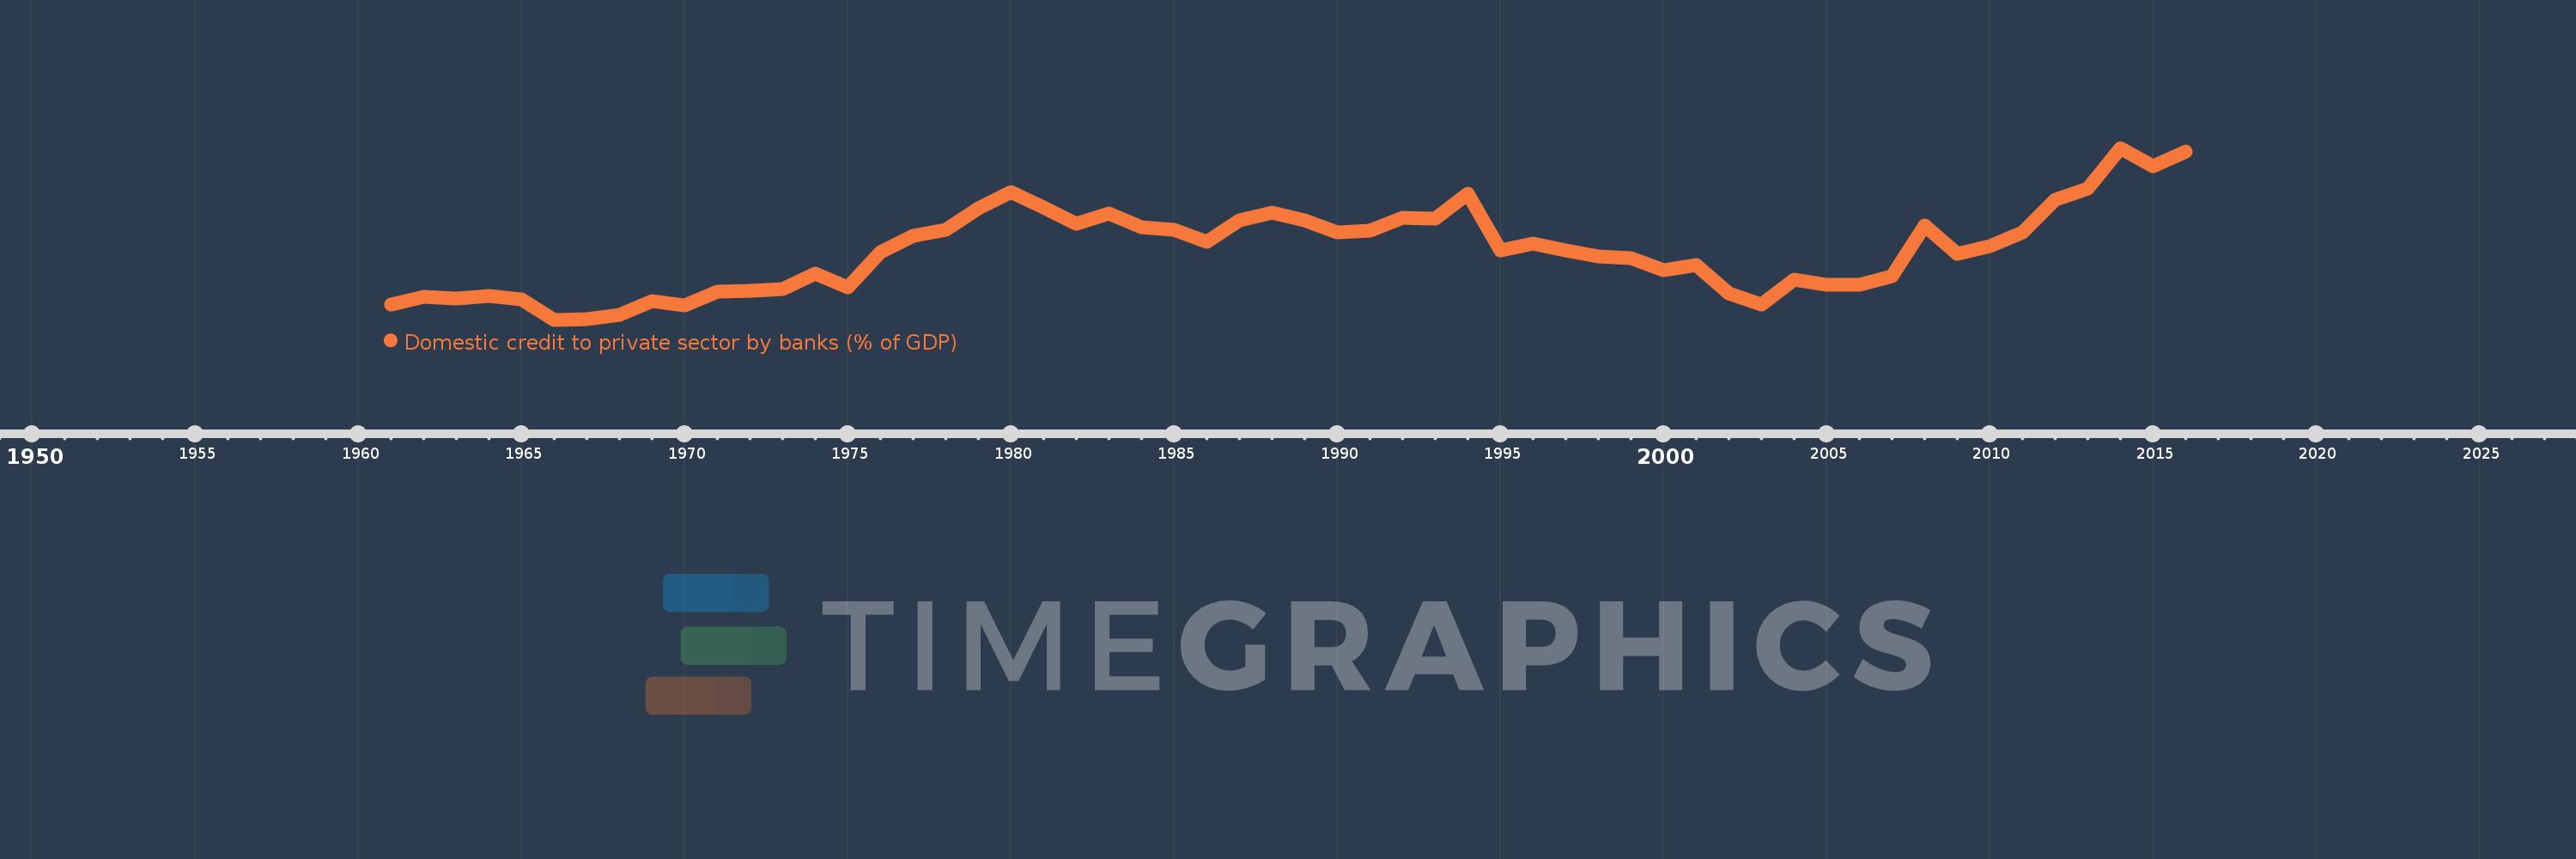
Domestic credit to private sector by banks (% of GDP)
2016,2015,2014,2013,2012,2011,2010,2009,2008,2007,2006,2005,2004,2003,2002,2001,2000,1999,1998,1997,1996,1995,1994,1993,1992,1991,1990,1989,1988,1987,1986,1985,1984,1983,1982,1981,1980,1979,1978,1977,1976,1975,1974,1973,1972,1971,1970,1969,1968,1967,1966,1965,1964,1963,1962,1961
This statistics in other country:
AfghanistanAlbaniaAlgeriaAngolaAntigua and BarbudaArab WorldArgentinaArmeniaArubaAustraliaAustriaAzerbaijanBahamas, TheBahrainBangladeshBarbadosBelarusBelgiumBelizeBeninBhutanBoliviaBosnia and HerzegovinaBotswanaBrazilBrunei DarussalamBulgariaBurkina FasoBurundiCabo VerdeCambodiaCameroonCanadaCaribbean small statesCentral African RepublicCentral Europe and the BalticsChadChileChinaColombiaComorosCongo, Dem. Rep.Congo, Rep.Costa RicaCote d'IvoireCroatiaCyprusCzech RepublicDenmarkDjiboutiDominicaDominican RepublicEarly-demographic dividendEast Asia & PacificEast Asia & Pacific (excluding high income)East Asia & Pacific (IDA & IBRD countries)EcuadorEgypt, Arab Rep.El SalvadorEquatorial GuineaEritreaEstoniaEthiopiaEuro areaEurope & Central AsiaEurope & Central Asia (excluding high income)Europe & Central Asia (IDA & IBRD countries)European UnionFijiFinlandFragile and conflict affected situationsFranceGabonGambia, TheGeorgiaGermanyGhanaGreeceGrenadaGuatemalaGuineaGuinea-BissauGuyanaHaitiHeavily indebted poor countries (HIPC)High incomeHondurasHong Kong SAR, ChinaHungaryIBRD onlyIcelandIDA & IBRD totalIDA blendIDA onlyIDA totalIndiaIndonesiaIran, Islamic Rep.IraqIrelandIsraelItalyJamaicaJapanJordanKazakhstanKenyaKorea, Rep.KosovoKuwaitKyrgyz RepublicLao PDRLate-demographic dividendLatin America & Caribbean Latin America & Caribbean (excluding high income)Latin America & the Caribbean (IDA & IBRD countries)LatviaLeast developed countries: UN classificationLebanonLesothoLiberiaLibyaLithuaniaLow & middle incomeLow incomeLower middle incomeLuxembourgMacao SAR, ChinaMacedonia, FYRMadagascarMalawiMalaysiaMaldivesMaliMaltaMauritaniaMauritiusMexicoMicronesia, Fed. Sts.Middle East & North AfricaMiddle East & North Africa (excluding high income)Middle East & North Africa (IDA & IBRD countries)Middle incomeMoldovaMongoliaMontenegroMoroccoMozambiqueMyanmarNamibiaNepalNetherlandsNew ZealandNicaraguaNigerNigeriaNorth AmericaNorwayOECD membersOmanOther small statesPacific island small statesPakistanPanamaPapua New GuineaParaguayPeruPhilippinesPolandPortugalPost-demographic dividendPre-demographic dividendQatarRomaniaRussian FederationRwandaSamoaSao Tome and PrincipeSaudi ArabiaSenegalSerbiaSeychellesSierra LeoneSingaporeSlovak RepublicSloveniaSmall statesSolomon IslandsSouth AfricaSouth AsiaSouth Asia (IDA & IBRD)South SudanSpainSri LankaSt. Kitts and NevisSt. LuciaSt. Vincent and the GrenadinesSub-Saharan Africa Sub-Saharan Africa (excluding high income)Sub-Saharan Africa (IDA & IBRD countries)SudanSurinameSwazilandSwedenSwitzerlandSyrian Arab RepublicTajikistanTanzaniaThailandTimor-LesteTogoTongaTrinidad and TobagoTunisiaTurkeyUgandaUkraineUnited Arab EmiratesUnited KingdomUnited StatesUpper middle incomeUruguayVanuatuVenezuela, RBVietnamWest Bank and GazaWorldYemen, Rep.ZambiaZimbabwe Timeline:
This timeline shows a graph from 1961 to 2016 of Togo. No data until 1960. Number of actual observations by date: 56.
Source name:
World Development Indicators
Source organization:
International Monetary Fund, International Financial Statistics and data files, and World Bank and OECD GDP estimates.
Categories, topics:
Financial Sector
Last updated:
apr 23, 2017
Indicators value changes by year
At the date of observation
Value
Absolute change
Change from previous value
jan 1, 1961
8.754
+8.754
0.0%
jan 1, 1962
10.065
+1.31
14.97%
jan 1, 1963
9.877
-0.188
-1.87%
jan 1, 1964
10.285
+0.408
4.13%
jan 1, 1965
9.681
-0.604
-5.88%
jan 1, 1966
5.882
-3.798
-39.24%
jan 1, 1967
5.97
+0.088
1.49%
jan 1, 1968
6.772
+0.802
13.44%
jan 1, 1969
9.362
+2.59
38.25%
jan 1, 1970
8.466
-0.897
-9.58%
jan 1, 1971
11.101
+2.636
31.13%
jan 1, 1972
11.278
+0.176
1.59%
jan 1, 1973
11.519
+0.241
2.14%
jan 1, 1974
14.485
+2.966
25.75%
jan 1, 1975
11.852
-2.632
-18.17%
jan 1, 1976
18.36
+6.507
54.9%
jan 1, 1977
21.422
+3.063
16.68%
jan 1, 1978
22.571
+1.149
5.36%
jan 1, 1979
26.451
+3.88
17.19%
jan 1, 1980
29.607
+3.156
11.93%
jan 1, 1981
26.71
-2.898
-9.79%
jan 1, 1982
23.702
-3.007
-11.26%
jan 1, 1983
25.619
+1.917
8.09%
jan 1, 1984
23.057
-2.562
-10.0%
jan 1, 1985
22.576
-0.481
-2.09%
jan 1, 1986
20.355
-2.221
-9.84%
jan 1, 1987
24.301
+3.946
19.39%
jan 1, 1988
25.682
+1.381
5.68%
jan 1, 1989
24.273
-1.408
-5.48%
jan 1, 1990
22.079
-2.195
-9.04%
jan 1, 1991
22.35
+0.271
1.23%
jan 1, 1992
24.771
+2.422
10.84%
jan 1, 1993
24.685
-0.086
-0.35%
jan 1, 1994
29.172
+4.487
18.18%
jan 1, 1995
18.668
-10.505
-36.01%
jan 1, 1996
19.95
+1.282
6.87%
jan 1, 1997
18.705
-1.245
-6.24%
jan 1, 1998
17.689
-1.016
-5.43%
jan 1, 1999
17.286
-0.403
-2.28%
jan 1, 2000
15.102
-2.184
-12.63%
jan 1, 2001
16.017
+0.915
6.06%
jan 1, 2002
10.759
-5.258
-32.83%
jan 1, 2003
8.634
-2.125
-19.75%
jan 1, 2004
13.255
+4.621
53.53%
jan 1, 2005
12.355
-0.9
-6.79%
jan 1, 2006
12.436
+0.081
0.65%
jan 1, 2007
13.917
+1.481
11.91%
jan 1, 2008
23.396
+9.479
68.11%
jan 1, 2009
18.079
-5.317
-22.72%
jan 1, 2010
19.461
+1.382
7.64%
jan 1, 2011
22.089
+2.628
13.5%
jan 1, 2012
28.106
+6.017
27.24%
jan 1, 2013
30.122
+2.016
7.17%
jan 1, 2014
37.71
+7.587
25.19%
jan 1, 2015
34.343
-3.367
-8.93%
jan 1, 2016
36.973
+2.631
7.66%
Ranking of countries by current statistics by years


Comments: