29
/
en
AIzaSyAYiBZKx7MnpbEhh9jyipgxe19OcubqV5w
April 1, 2024
76045
Bahamas, The
BHS
true
2
1
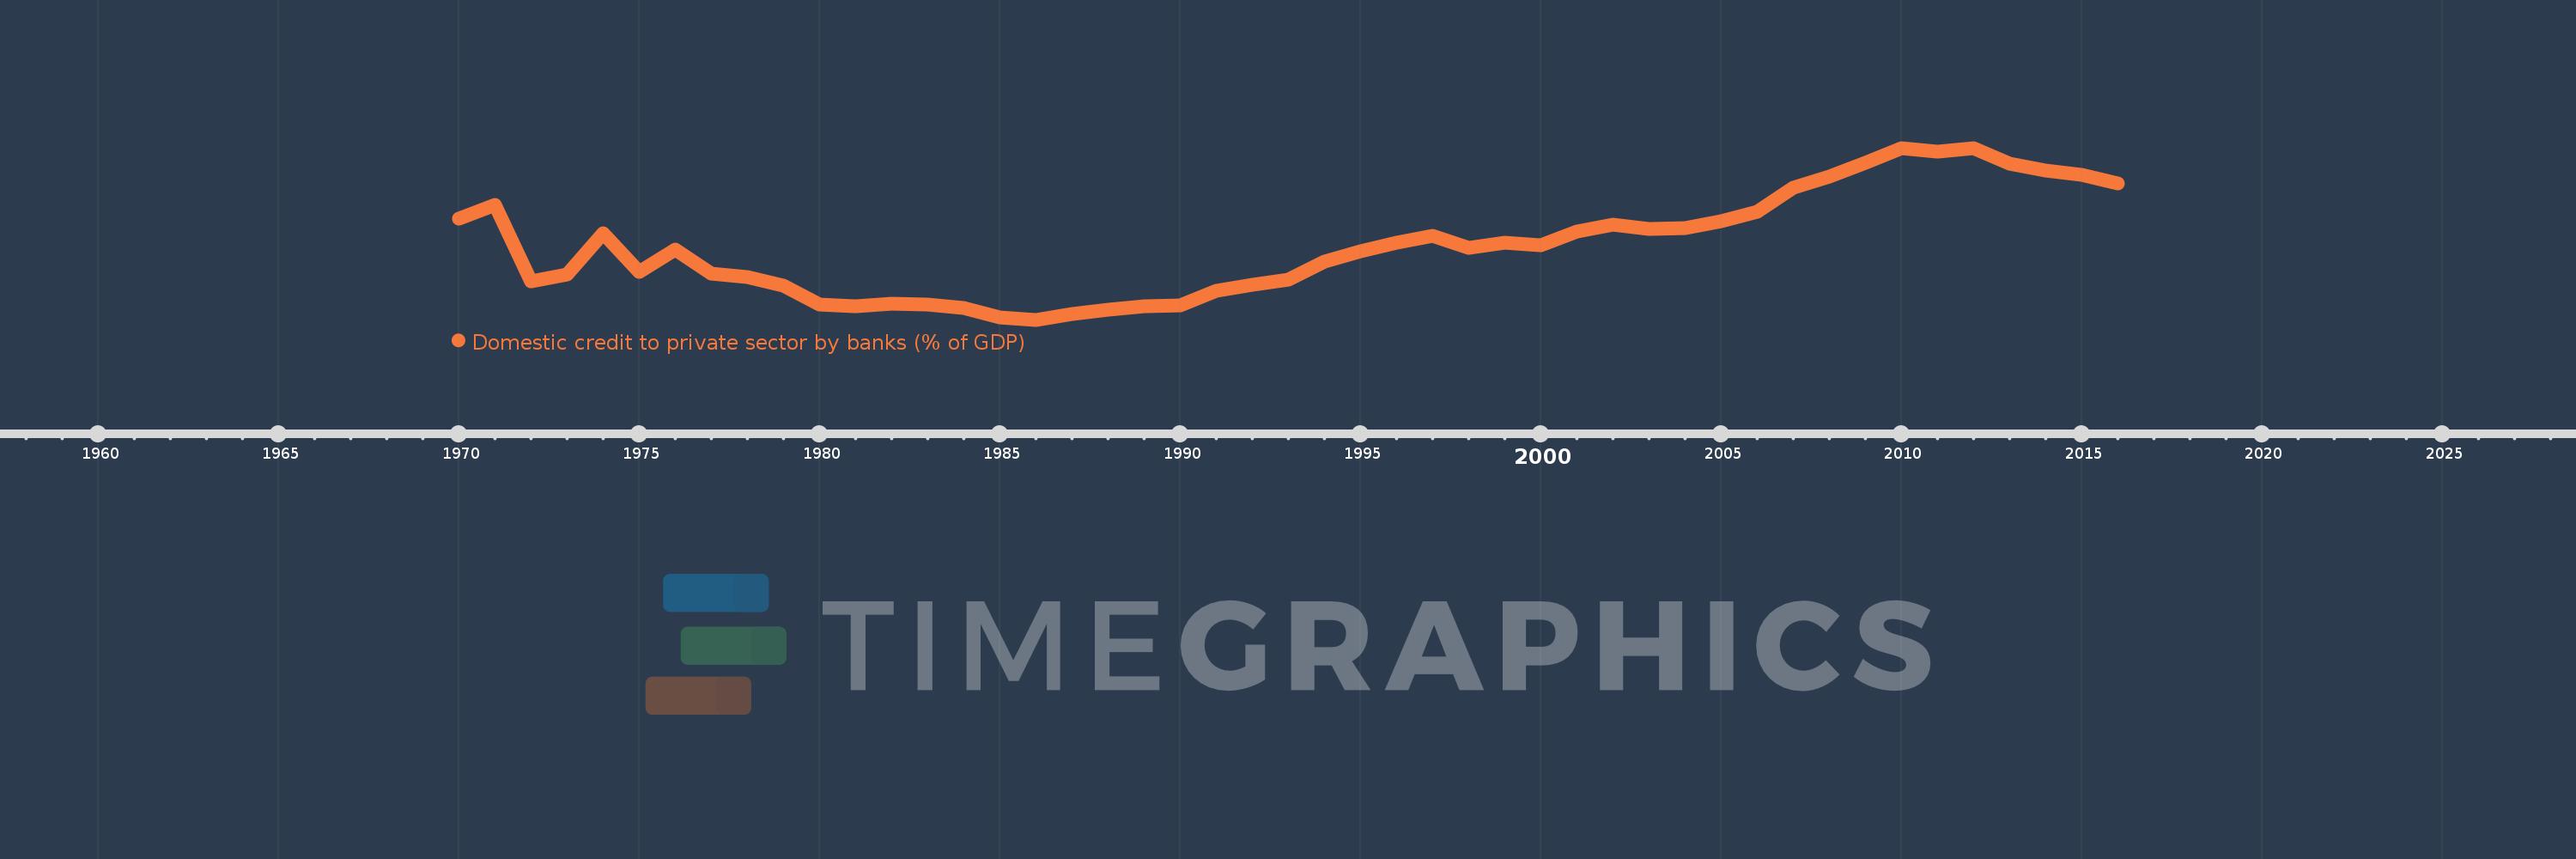
Domestic credit to private sector by banks (% of GDP)
2016,2015,2014,2013,2012,2011,2010,2009,2008,2007,2006,2005,2004,2003,2002,2001,2000,1999,1998,1997,1996,1995,1994,1993,1992,1991,1990,1989,1988,1987,1986,1985,1984,1983,1982,1981,1980,1979,1978,1977,1976,1975,1974,1973,1972,1971,1970
This statistics in other country:
AfghanistanAlbaniaAlgeriaAngolaAntigua and BarbudaArab WorldArgentinaArmeniaArubaAustraliaAustriaAzerbaijanBahamas, TheBahrainBangladeshBarbadosBelarusBelgiumBelizeBeninBhutanBoliviaBosnia and HerzegovinaBotswanaBrazilBrunei DarussalamBulgariaBurkina FasoBurundiCabo VerdeCambodiaCameroonCanadaCaribbean small statesCentral African RepublicCentral Europe and the BalticsChadChileChinaColombiaComorosCongo, Dem. Rep.Congo, Rep.Costa RicaCote d'IvoireCroatiaCyprusCzech RepublicDenmarkDjiboutiDominicaDominican RepublicEarly-demographic dividendEast Asia & PacificEast Asia & Pacific (excluding high income)East Asia & Pacific (IDA & IBRD countries)EcuadorEgypt, Arab Rep.El SalvadorEquatorial GuineaEritreaEstoniaEthiopiaEuro areaEurope & Central AsiaEurope & Central Asia (excluding high income)Europe & Central Asia (IDA & IBRD countries)European UnionFijiFinlandFragile and conflict affected situationsFranceGabonGambia, TheGeorgiaGermanyGhanaGreeceGrenadaGuatemalaGuineaGuinea-BissauGuyanaHaitiHeavily indebted poor countries (HIPC)High incomeHondurasHong Kong SAR, ChinaHungaryIBRD onlyIcelandIDA & IBRD totalIDA blendIDA onlyIDA totalIndiaIndonesiaIran, Islamic Rep.IraqIrelandIsraelItalyJamaicaJapanJordanKazakhstanKenyaKorea, Rep.KosovoKuwaitKyrgyz RepublicLao PDRLate-demographic dividendLatin America & Caribbean Latin America & Caribbean (excluding high income)Latin America & the Caribbean (IDA & IBRD countries)LatviaLeast developed countries: UN classificationLebanonLesothoLiberiaLibyaLithuaniaLow & middle incomeLow incomeLower middle incomeLuxembourgMacao SAR, ChinaMacedonia, FYRMadagascarMalawiMalaysiaMaldivesMaliMaltaMauritaniaMauritiusMexicoMicronesia, Fed. Sts.Middle East & North AfricaMiddle East & North Africa (excluding high income)Middle East & North Africa (IDA & IBRD countries)Middle incomeMoldovaMongoliaMontenegroMoroccoMozambiqueMyanmarNamibiaNepalNetherlandsNew ZealandNicaraguaNigerNigeriaNorth AmericaNorwayOECD membersOmanOther small statesPacific island small statesPakistanPanamaPapua New GuineaParaguayPeruPhilippinesPolandPortugalPost-demographic dividendPre-demographic dividendQatarRomaniaRussian FederationRwandaSamoaSao Tome and PrincipeSaudi ArabiaSenegalSerbiaSeychellesSierra LeoneSingaporeSlovak RepublicSloveniaSmall statesSolomon IslandsSouth AfricaSouth AsiaSouth Asia (IDA & IBRD)South SudanSpainSri LankaSt. Kitts and NevisSt. LuciaSt. Vincent and the GrenadinesSub-Saharan Africa Sub-Saharan Africa (excluding high income)Sub-Saharan Africa (IDA & IBRD countries)SudanSurinameSwazilandSwedenSwitzerlandSyrian Arab RepublicTajikistanTanzaniaThailandTimor-LesteTogoTongaTrinidad and TobagoTunisiaTurkeyUgandaUkraineUnited Arab EmiratesUnited KingdomUnited StatesUpper middle incomeUruguayVanuatuVenezuela, RBVietnamWest Bank and GazaWorldYemen, Rep.ZambiaZimbabwe Timeline:
This timeline shows a graph from 1970 to 2016 of Bahamas, The. No data until 1969. Number of actual observations by date: 47.
Source name:
World Development Indicators
Source organization:
International Monetary Fund, International Financial Statistics and data files, and World Bank and OECD GDP estimates.
Categories, topics:
Financial Sector
Last updated:
apr 23, 2017
Indicators value changes by year
Minimum:
25.522
jan 1, 1986
Maximum:
84.033
jan 1, 2010
At the date of observation
Value
Absolute change
Change from previous value
jan 1, 1970
59.959
+59.959
0.0%
jan 1, 1971
64.708
+4.749
7.92%
jan 1, 1972
38.507
-26.201
-40.49%
jan 1, 1973
40.904
+2.397
6.22%
jan 1, 1974
55.105
+14.201
34.72%
jan 1, 1975
41.872
-13.233
-24.01%
jan 1, 1976
49.329
+7.457
17.81%
jan 1, 1977
41.255
-8.074
-16.37%
jan 1, 1978
40.196
-1.059
-2.57%
jan 1, 1979
37.158
-3.039
-7.56%
jan 1, 1980
30.567
-6.591
-17.74%
jan 1, 1981
30.166
-0.401
-1.31%
jan 1, 1982
31.083
+0.918
3.04%
jan 1, 1983
30.609
-0.474
-1.53%
jan 1, 1984
29.415
-1.194
-3.9%
jan 1, 1985
26.206
-3.208
-10.91%
jan 1, 1986
25.522
-0.684
-2.61%
jan 1, 1987
27.385
+1.863
7.3%
jan 1, 1988
29.053
+1.668
6.09%
jan 1, 1989
30.232
+1.179
4.06%
jan 1, 1990
30.281
+0.049
0.16%
jan 1, 1991
35.452
+5.171
17.08%
jan 1, 1992
37.394
+1.943
5.48%
jan 1, 1993
39.093
+1.699
4.54%
jan 1, 1994
45.278
+6.185
15.82%
jan 1, 1995
48.837
+3.559
7.86%
jan 1, 1996
51.831
+2.994
6.13%
jan 1, 1997
54.109
+2.278
4.39%
jan 1, 1998
50.153
-3.956
-7.31%
jan 1, 1999
51.693
+1.54
3.07%
jan 1, 2000
51.022
-0.671
-1.3%
jan 1, 2001
55.491
+4.469
8.76%
jan 1, 2002
58.034
+2.544
4.58%
jan 1, 2003
56.419
-1.616
-2.78%
jan 1, 2004
56.808
+0.39
0.69%
jan 1, 2005
59.196
+2.387
4.2%
jan 1, 2006
62.378
+3.182
5.38%
jan 1, 2007
70.389
+8.011
12.84%
jan 1, 2008
74.391
+4.002
5.69%
jan 1, 2009
78.982
+4.591
6.17%
jan 1, 2010
84.033
+5.05
6.39%
jan 1, 2011
82.889
-1.143
-1.36%
jan 1, 2012
84.027
+1.137
1.37%
jan 1, 2013
78.731
-5.296
-6.3%
jan 1, 2014
76.23
-2.501
-3.18%
jan 1, 2015
74.792
-1.438
-1.89%
jan 1, 2016
71.984
-2.808
-3.75%
Ranking of countries by current statistics by years


Comments: