29
/
en
AIzaSyAYiBZKx7MnpbEhh9jyipgxe19OcubqV5w
April 1, 2024
120829
Dominica
DMA
true
2
1
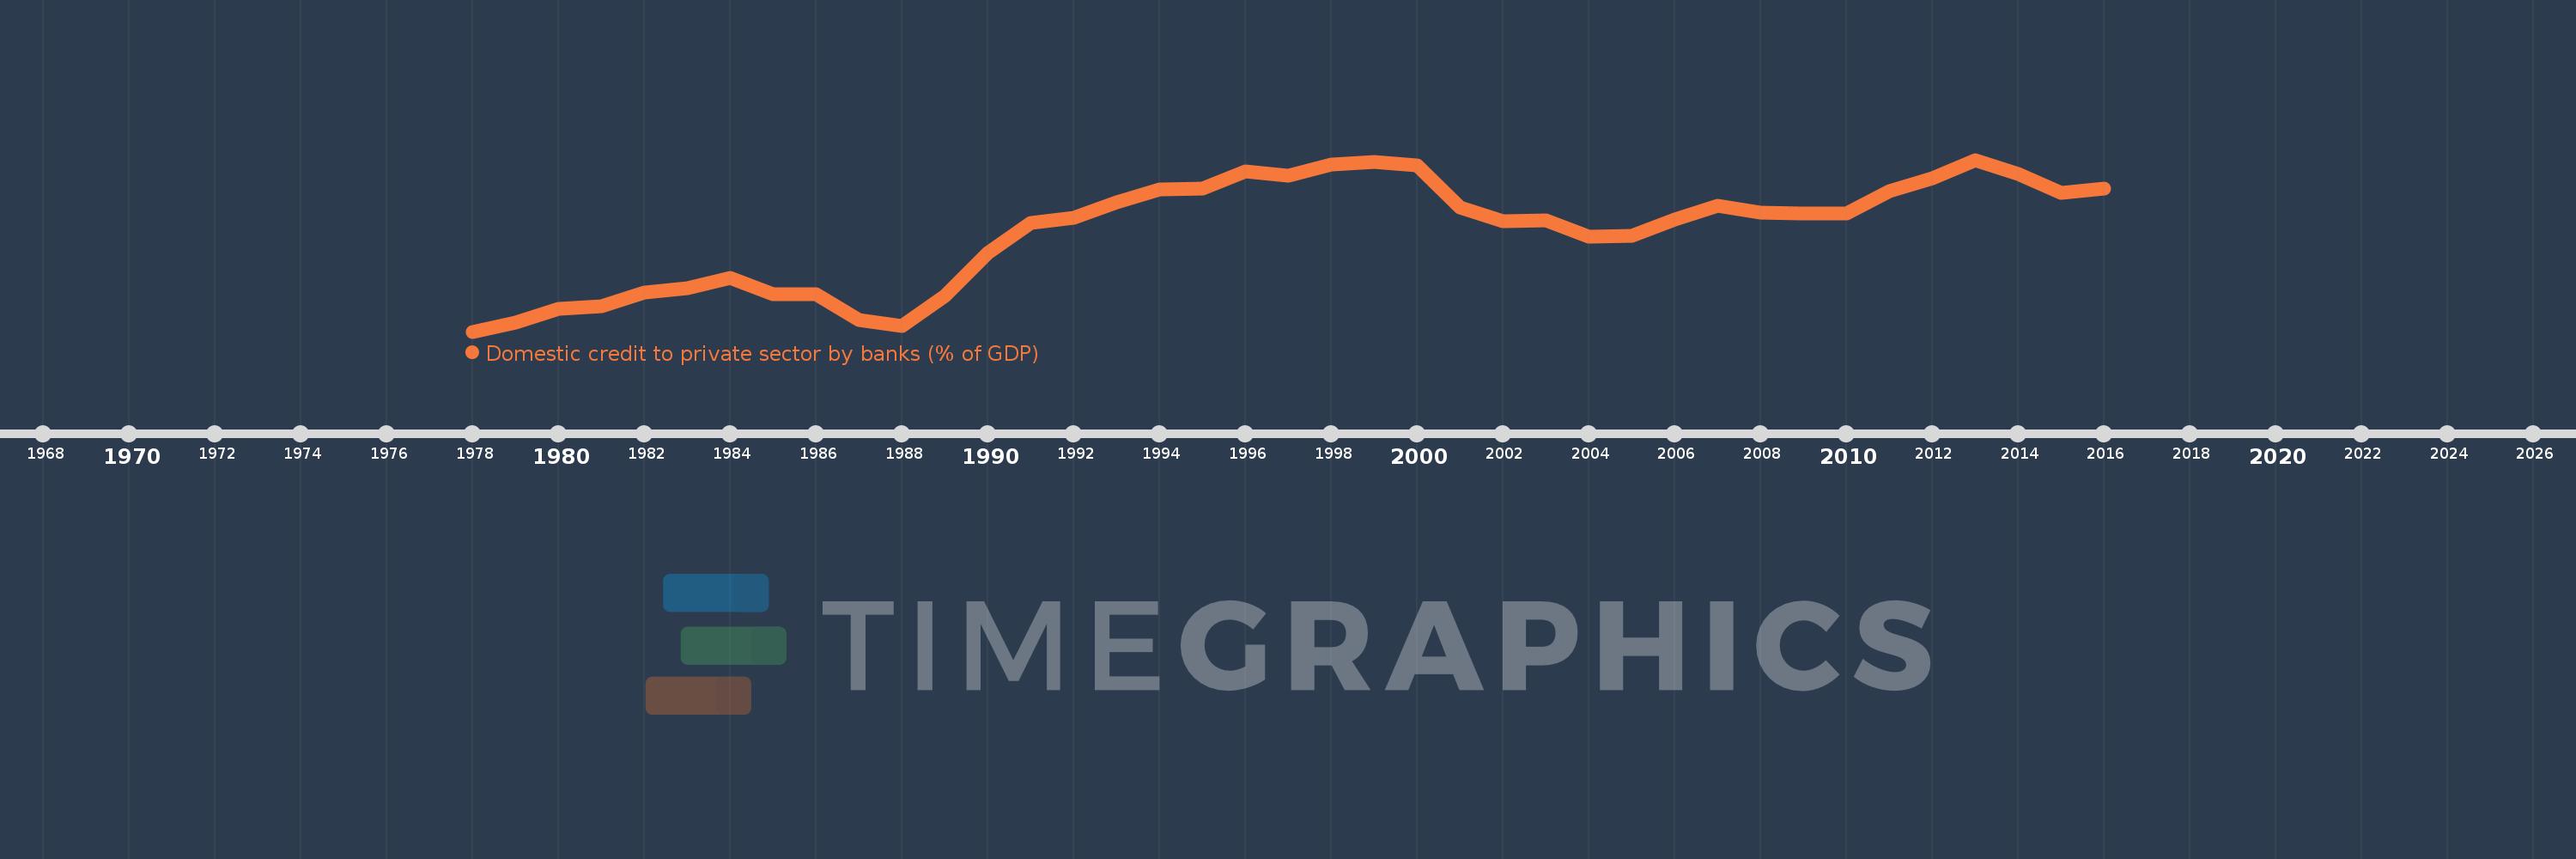
Domestic credit to private sector by banks (% of GDP)
2016,2015,2014,2013,2012,2011,2010,2009,2008,2007,2006,2005,2004,2003,2002,2001,2000,1999,1998,1997,1996,1995,1994,1993,1992,1991,1990,1989,1988,1987,1986,1985,1984,1983,1982,1981,1980,1979,1978
This statistics in other country:
AfghanistanAlbaniaAlgeriaAngolaAntigua and BarbudaArab WorldArgentinaArmeniaArubaAustraliaAustriaAzerbaijanBahamas, TheBahrainBangladeshBarbadosBelarusBelgiumBelizeBeninBhutanBoliviaBosnia and HerzegovinaBotswanaBrazilBrunei DarussalamBulgariaBurkina FasoBurundiCabo VerdeCambodiaCameroonCanadaCaribbean small statesCentral African RepublicCentral Europe and the BalticsChadChileChinaColombiaComorosCongo, Dem. Rep.Congo, Rep.Costa RicaCote d'IvoireCroatiaCyprusCzech RepublicDenmarkDjiboutiDominicaDominican RepublicEarly-demographic dividendEast Asia & PacificEast Asia & Pacific (excluding high income)East Asia & Pacific (IDA & IBRD countries)EcuadorEgypt, Arab Rep.El SalvadorEquatorial GuineaEritreaEstoniaEthiopiaEuro areaEurope & Central AsiaEurope & Central Asia (excluding high income)Europe & Central Asia (IDA & IBRD countries)European UnionFijiFinlandFragile and conflict affected situationsFranceGabonGambia, TheGeorgiaGermanyGhanaGreeceGrenadaGuatemalaGuineaGuinea-BissauGuyanaHaitiHeavily indebted poor countries (HIPC)High incomeHondurasHong Kong SAR, ChinaHungaryIBRD onlyIcelandIDA & IBRD totalIDA blendIDA onlyIDA totalIndiaIndonesiaIran, Islamic Rep.IraqIrelandIsraelItalyJamaicaJapanJordanKazakhstanKenyaKorea, Rep.KosovoKuwaitKyrgyz RepublicLao PDRLate-demographic dividendLatin America & Caribbean Latin America & Caribbean (excluding high income)Latin America & the Caribbean (IDA & IBRD countries)LatviaLeast developed countries: UN classificationLebanonLesothoLiberiaLibyaLithuaniaLow & middle incomeLow incomeLower middle incomeLuxembourgMacao SAR, ChinaMacedonia, FYRMadagascarMalawiMalaysiaMaldivesMaliMaltaMauritaniaMauritiusMexicoMicronesia, Fed. Sts.Middle East & North AfricaMiddle East & North Africa (excluding high income)Middle East & North Africa (IDA & IBRD countries)Middle incomeMoldovaMongoliaMontenegroMoroccoMozambiqueMyanmarNamibiaNepalNetherlandsNew ZealandNicaraguaNigerNigeriaNorth AmericaNorwayOECD membersOmanOther small statesPacific island small statesPakistanPanamaPapua New GuineaParaguayPeruPhilippinesPolandPortugalPost-demographic dividendPre-demographic dividendQatarRomaniaRussian FederationRwandaSamoaSao Tome and PrincipeSaudi ArabiaSenegalSerbiaSeychellesSierra LeoneSingaporeSlovak RepublicSloveniaSmall statesSolomon IslandsSouth AfricaSouth AsiaSouth Asia (IDA & IBRD)South SudanSpainSri LankaSt. Kitts and NevisSt. LuciaSt. Vincent and the GrenadinesSub-Saharan Africa Sub-Saharan Africa (excluding high income)Sub-Saharan Africa (IDA & IBRD countries)SudanSurinameSwazilandSwedenSwitzerlandSyrian Arab RepublicTajikistanTanzaniaThailandTimor-LesteTogoTongaTrinidad and TobagoTunisiaTurkeyUgandaUkraineUnited Arab EmiratesUnited KingdomUnited StatesUpper middle incomeUruguayVanuatuVenezuela, RBVietnamWest Bank and GazaWorldYemen, Rep.ZambiaZimbabwe Timeline:
This timeline shows a graph from 1978 to 2016 of Dominica. No data until 1977. Number of actual observations by date: 39.
Source name:
World Development Indicators
Source organization:
International Monetary Fund, International Financial Statistics and data files, and World Bank and OECD GDP estimates.
Categories, topics:
Financial Sector
Last updated:
apr 23, 2017
Indicators value changes by year
Minimum:
26.332
jan 1, 1978
Maximum:
59.127
jan 1, 2013
At the date of observation
Value
Absolute change
Change from previous value
jan 1, 1978
26.332
+26.332
0.0%
jan 1, 1979
28.096
+1.764
6.7%
jan 1, 1980
30.733
+2.637
9.39%
jan 1, 1981
31.196
+0.463
1.51%
jan 1, 1982
33.839
+2.643
8.47%
jan 1, 1983
34.694
+0.855
2.53%
jan 1, 1984
36.641
+1.947
5.61%
jan 1, 1985
33.521
-3.121
-8.52%
jan 1, 1986
33.445
-0.075
-0.22%
jan 1, 1987
28.473
-4.973
-14.87%
jan 1, 1988
27.435
-1.038
-3.64%
jan 1, 1989
33.162
+5.727
20.87%
jan 1, 1990
41.412
+8.25
24.88%
jan 1, 1991
47.015
+5.603
13.53%
jan 1, 1992
48.12
+1.104
2.35%
jan 1, 1993
50.988
+2.868
5.96%
jan 1, 1994
53.513
+2.525
4.95%
jan 1, 1995
53.715
+0.202
0.38%
jan 1, 1996
56.974
+3.258
6.07%
jan 1, 1997
56.153
-0.82
-1.44%
jan 1, 1998
58.219
+2.065
3.68%
jan 1, 1999
58.753
+0.534
0.92%
jan 1, 2000
58.068
-0.685
-1.17%
jan 1, 2001
50.077
-7.992
-13.76%
jan 1, 2002
47.449
-2.628
-5.25%
jan 1, 2003
47.527
+0.078
0.16%
jan 1, 2004
44.498
-3.028
-6.37%
jan 1, 2005
44.536
+0.038
0.09%
jan 1, 2006
47.784
+3.248
7.29%
jan 1, 2007
50.399
+2.615
5.47%
jan 1, 2008
49.12
-1.279
-2.54%
jan 1, 2009
48.956
-0.164
-0.33%
jan 1, 2010
48.917
-0.04
-0.08%
jan 1, 2011
53.103
+4.186
8.56%
jan 1, 2012
55.619
+2.516
4.74%
jan 1, 2013
59.127
+3.508
6.31%
jan 1, 2014
56.471
-2.657
-4.49%
jan 1, 2015
52.887
-3.583
-6.35%
jan 1, 2016
53.639
+0.752
1.42%
Ranking of countries by current statistics by years


Comments: