29
/
en
AIzaSyAYiBZKx7MnpbEhh9jyipgxe19OcubqV5w
April 1, 2024
181957
Luxembourg
LUX
true
2
1
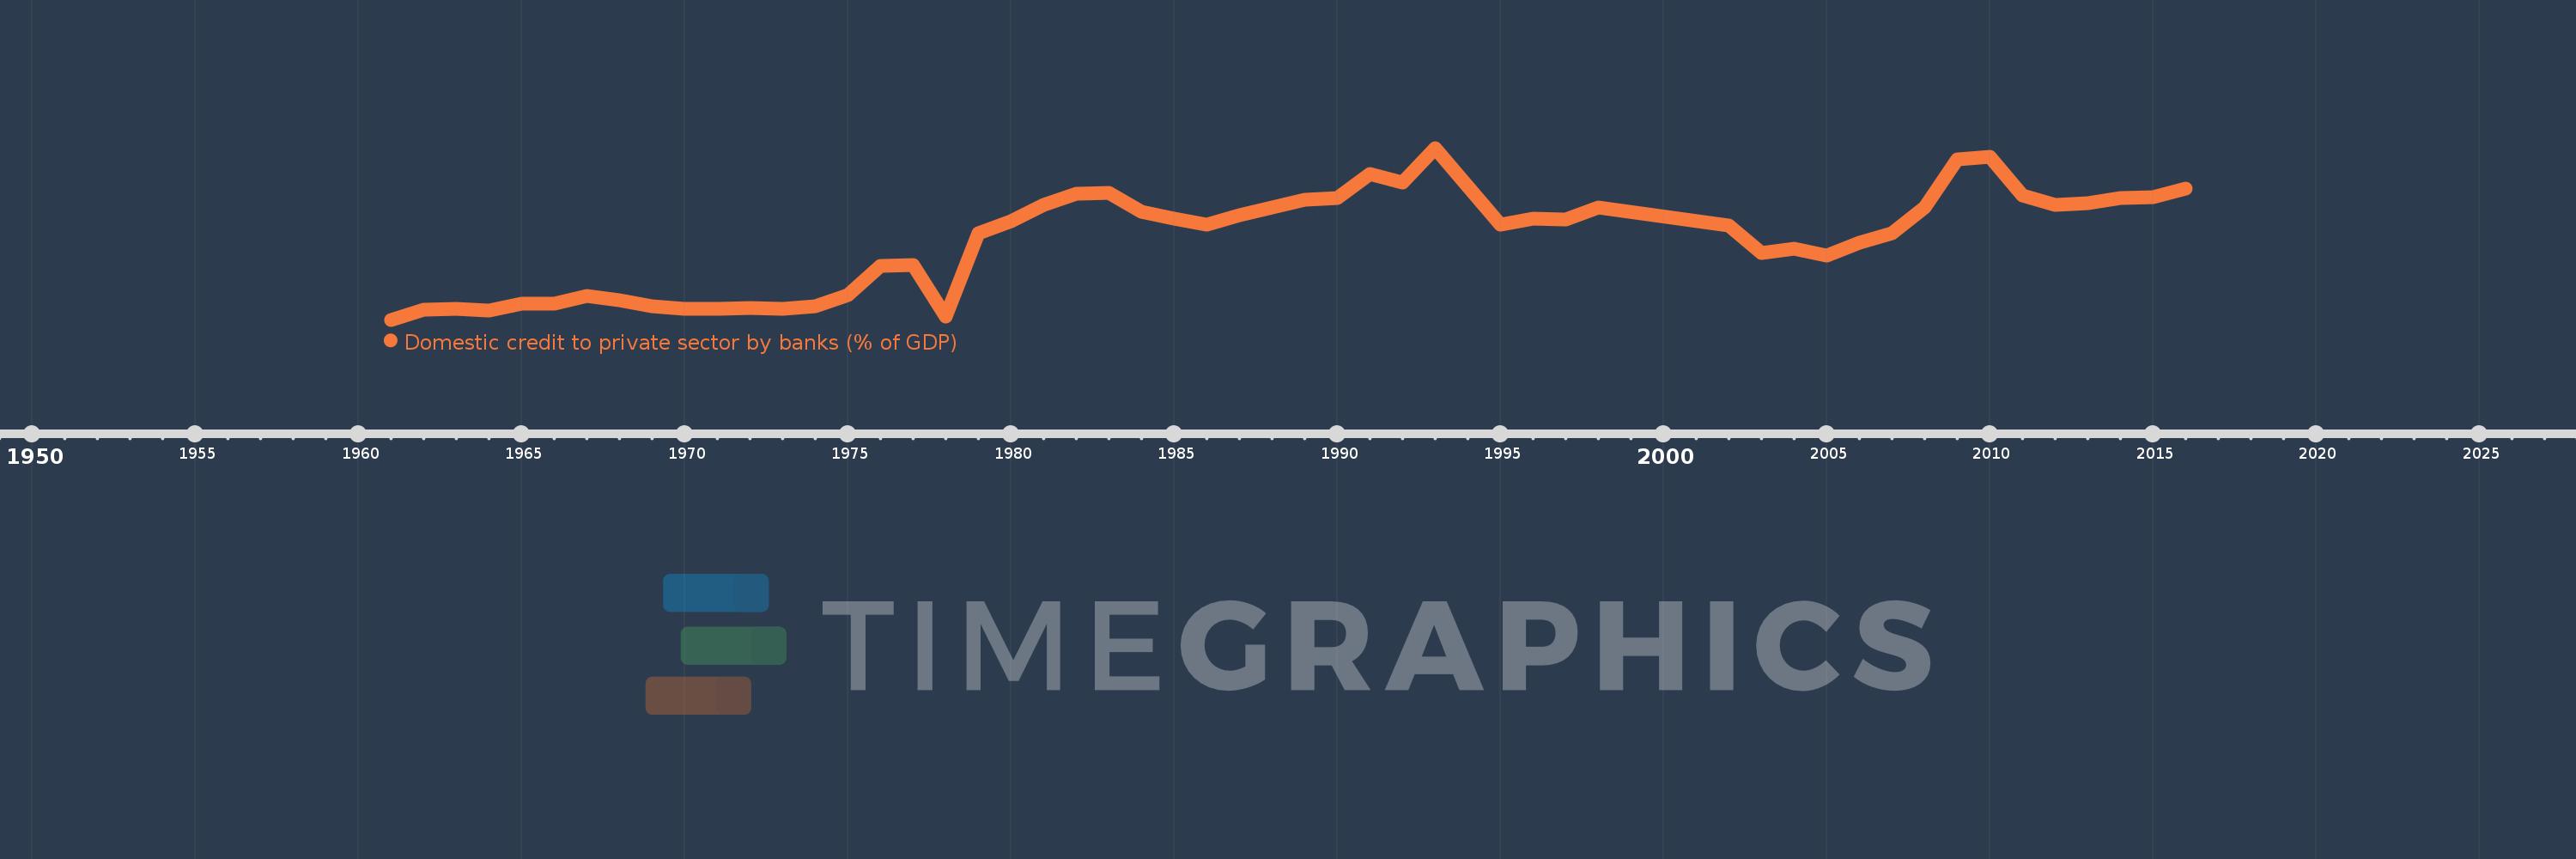
Domestic credit to private sector by banks (% of GDP)
2016,2015,2014,2013,2012,2011,2010,2009,2008,2007,2006,2005,2004,2003,2002,1998,1997,1996,1995,1993,1992,1991,1990,1989,1988,1987,1986,1985,1984,1983,1982,1981,1980,1979,1978,1977,1976,1975,1974,1973,1972,1971,1970,1969,1968,1967,1966,1965,1964,1963,1962,1961
This statistics in other country:
AfghanistanAlbaniaAlgeriaAngolaAntigua and BarbudaArab WorldArgentinaArmeniaArubaAustraliaAustriaAzerbaijanBahamas, TheBahrainBangladeshBarbadosBelarusBelgiumBelizeBeninBhutanBoliviaBosnia and HerzegovinaBotswanaBrazilBrunei DarussalamBulgariaBurkina FasoBurundiCabo VerdeCambodiaCameroonCanadaCaribbean small statesCentral African RepublicCentral Europe and the BalticsChadChileChinaColombiaComorosCongo, Dem. Rep.Congo, Rep.Costa RicaCote d'IvoireCroatiaCyprusCzech RepublicDenmarkDjiboutiDominicaDominican RepublicEarly-demographic dividendEast Asia & PacificEast Asia & Pacific (excluding high income)East Asia & Pacific (IDA & IBRD countries)EcuadorEgypt, Arab Rep.El SalvadorEquatorial GuineaEritreaEstoniaEthiopiaEuro areaEurope & Central AsiaEurope & Central Asia (excluding high income)Europe & Central Asia (IDA & IBRD countries)European UnionFijiFinlandFragile and conflict affected situationsFranceGabonGambia, TheGeorgiaGermanyGhanaGreeceGrenadaGuatemalaGuineaGuinea-BissauGuyanaHaitiHeavily indebted poor countries (HIPC)High incomeHondurasHong Kong SAR, ChinaHungaryIBRD onlyIcelandIDA & IBRD totalIDA blendIDA onlyIDA totalIndiaIndonesiaIran, Islamic Rep.IraqIrelandIsraelItalyJamaicaJapanJordanKazakhstanKenyaKorea, Rep.KosovoKuwaitKyrgyz RepublicLao PDRLate-demographic dividendLatin America & Caribbean Latin America & Caribbean (excluding high income)Latin America & the Caribbean (IDA & IBRD countries)LatviaLeast developed countries: UN classificationLebanonLesothoLiberiaLibyaLithuaniaLow & middle incomeLow incomeLower middle incomeLuxembourgMacao SAR, ChinaMacedonia, FYRMadagascarMalawiMalaysiaMaldivesMaliMaltaMauritaniaMauritiusMexicoMicronesia, Fed. Sts.Middle East & North AfricaMiddle East & North Africa (excluding high income)Middle East & North Africa (IDA & IBRD countries)Middle incomeMoldovaMongoliaMontenegroMoroccoMozambiqueMyanmarNamibiaNepalNetherlandsNew ZealandNicaraguaNigerNigeriaNorth AmericaNorwayOECD membersOmanOther small statesPacific island small statesPakistanPanamaPapua New GuineaParaguayPeruPhilippinesPolandPortugalPost-demographic dividendPre-demographic dividendQatarRomaniaRussian FederationRwandaSamoaSao Tome and PrincipeSaudi ArabiaSenegalSerbiaSeychellesSierra LeoneSingaporeSlovak RepublicSloveniaSmall statesSolomon IslandsSouth AfricaSouth AsiaSouth Asia (IDA & IBRD)South SudanSpainSri LankaSt. Kitts and NevisSt. LuciaSt. Vincent and the GrenadinesSub-Saharan Africa Sub-Saharan Africa (excluding high income)Sub-Saharan Africa (IDA & IBRD countries)SudanSurinameSwazilandSwedenSwitzerlandSyrian Arab RepublicTajikistanTanzaniaThailandTimor-LesteTogoTongaTrinidad and TobagoTunisiaTurkeyUgandaUkraineUnited Arab EmiratesUnited KingdomUnited StatesUpper middle incomeUruguayVanuatuVenezuela, RBVietnamWest Bank and GazaWorldYemen, Rep.ZambiaZimbabwe Timeline:
This timeline shows a graph from 1961 to 2016 of Luxembourg. No data until 1960. Number of actual observations by date: 52.
Source name:
World Development Indicators
Source organization:
International Monetary Fund, International Financial Statistics and data files, and World Bank and OECD GDP estimates.
Categories, topics:
Financial Sector
Last updated:
apr 23, 2017
Indicators value changes by year
Minimum:
40.203
jan 1, 1961
Maximum:
112.314
jan 1, 1993
At the date of observation
Value
Absolute change
Change from previous value
jan 1, 1961
40.203
+40.203
0.0%
jan 1, 1962
44.423
+4.22
10.5%
jan 1, 1963
44.639
+0.216
0.49%
jan 1, 1964
43.987
-0.652
-1.46%
jan 1, 1965
46.858
+2.871
6.53%
jan 1, 1966
46.94
+0.082
0.18%
jan 1, 1967
50.184
+3.244
6.91%
jan 1, 1968
48.321
-1.862
-3.71%
jan 1, 1969
46.022
-2.3
-4.76%
jan 1, 1970
44.944
-1.078
-2.34%
jan 1, 1971
44.679
-0.264
-0.59%
jan 1, 1972
45.089
+0.41
0.92%
jan 1, 1973
44.694
-0.395
-0.88%
jan 1, 1974
45.832
+1.138
2.55%
jan 1, 1975
50.609
+4.777
10.42%
jan 1, 1976
62.69
+12.08
23.87%
jan 1, 1977
63.221
+0.531
0.85%
jan 1, 1978
41.395
-21.825
-34.52%
jan 1, 1979
76.397
+35.002
84.56%
jan 1, 1980
81.385
+4.988
6.53%
jan 1, 1981
88.485
+7.099
8.72%
jan 1, 1982
93.131
+4.647
5.25%
jan 1, 1983
93.286
+0.154
0.17%
jan 1, 1984
85.634
-7.652
-8.2%
jan 1, 1985
82.49
-3.144
-3.67%
jan 1, 1986
80.159
-2.331
-2.83%
jan 1, 1987
84.231
+4.072
5.08%
jan 1, 1988
87.37
+3.14
3.73%
jan 1, 1989
90.517
+3.146
3.6%
jan 1, 1990
91.204
+0.687
0.76%
jan 1, 1991
101.26
+10.056
11.03%
jan 1, 1992
97.686
-3.574
-3.53%
jan 1, 1993
112.314
+14.627
14.97%
jan 1, 1995
80.092
-32.221
-28.69%
jan 1, 1996
82.787
+2.695
3.36%
jan 1, 1997
82.14
-0.647
-0.78%
jan 1, 1998
87.433
+5.293
6.44%
jan 1, 2002
79.636
-7.797
-8.92%
jan 1, 2003
68.157
-11.479
-14.41%
jan 1, 2004
69.988
+1.831
2.69%
jan 1, 2005
67.258
-2.73
-3.9%
jan 1, 2006
72.585
+5.326
7.92%
jan 1, 2007
76.437
+3.852
5.31%
jan 1, 2008
87.344
+10.907
14.27%
jan 1, 2009
107.5
+20.156
23.08%
jan 1, 2010
108.721
+1.22
1.14%
jan 1, 2011
92.386
-16.335
-15.02%
jan 1, 2012
88.356
-4.03
-4.36%
jan 1, 2013
89.246
+0.89
1.01%
jan 1, 2014
91.416
+2.17
2.43%
jan 1, 2015
91.624
+0.208
0.23%
jan 1, 2016
95.361
+3.737
4.08%
Ranking of countries by current statistics by years


Comments: