29
/
en
AIzaSyAYiBZKx7MnpbEhh9jyipgxe19OcubqV5w
April 1, 2024
142890
Grenada
GRD
true
2
1
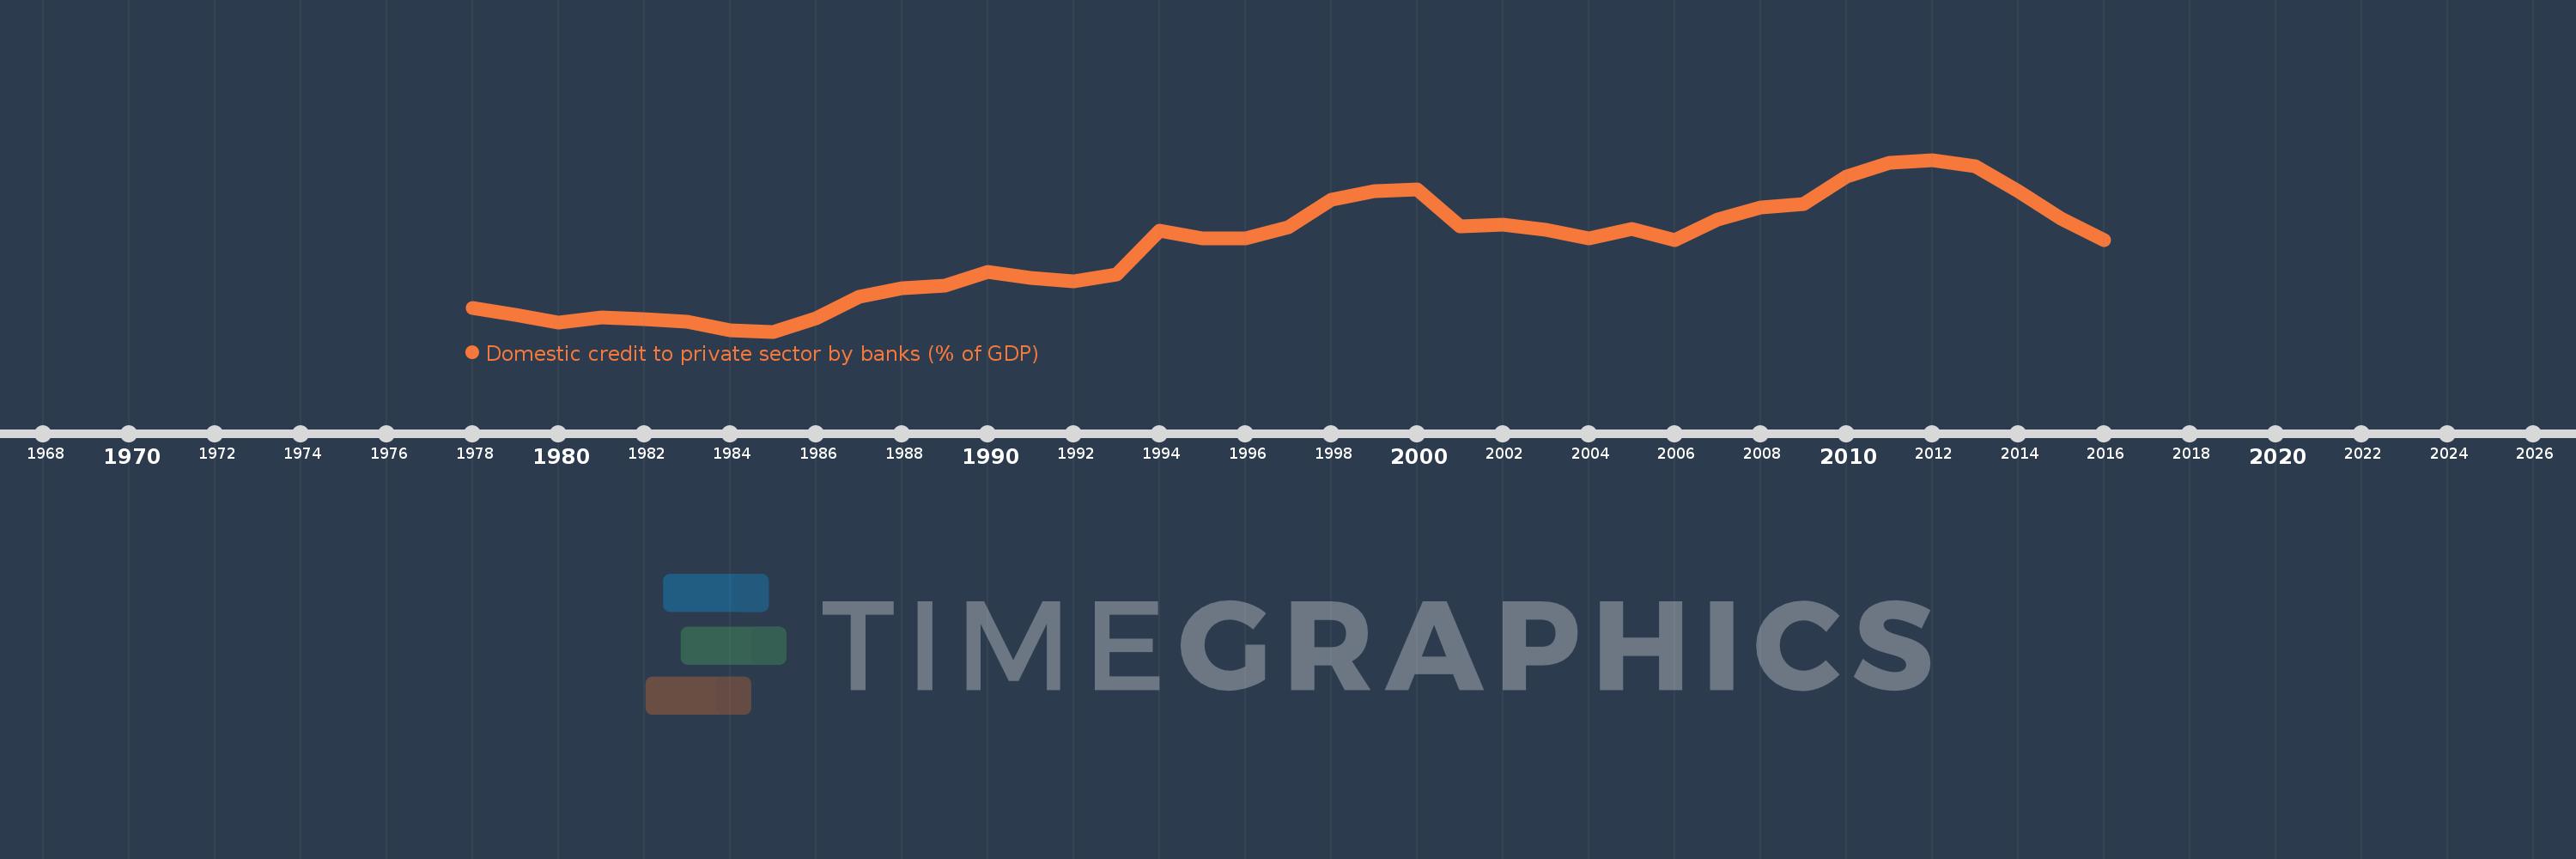
Domestic credit to private sector by banks (% of GDP)
2016,2015,2014,2013,2012,2011,2010,2009,2008,2007,2006,2005,2004,2003,2002,2001,2000,1999,1998,1997,1996,1995,1994,1993,1992,1991,1990,1989,1988,1987,1986,1985,1984,1983,1982,1981,1980,1979,1978
This statistics in other country:
AfghanistanAlbaniaAlgeriaAngolaAntigua and BarbudaArab WorldArgentinaArmeniaArubaAustraliaAustriaAzerbaijanBahamas, TheBahrainBangladeshBarbadosBelarusBelgiumBelizeBeninBhutanBoliviaBosnia and HerzegovinaBotswanaBrazilBrunei DarussalamBulgariaBurkina FasoBurundiCabo VerdeCambodiaCameroonCanadaCaribbean small statesCentral African RepublicCentral Europe and the BalticsChadChileChinaColombiaComorosCongo, Dem. Rep.Congo, Rep.Costa RicaCote d'IvoireCroatiaCyprusCzech RepublicDenmarkDjiboutiDominicaDominican RepublicEarly-demographic dividendEast Asia & PacificEast Asia & Pacific (excluding high income)East Asia & Pacific (IDA & IBRD countries)EcuadorEgypt, Arab Rep.El SalvadorEquatorial GuineaEritreaEstoniaEthiopiaEuro areaEurope & Central AsiaEurope & Central Asia (excluding high income)Europe & Central Asia (IDA & IBRD countries)European UnionFijiFinlandFragile and conflict affected situationsFranceGabonGambia, TheGeorgiaGermanyGhanaGreeceGrenadaGuatemalaGuineaGuinea-BissauGuyanaHaitiHeavily indebted poor countries (HIPC)High incomeHondurasHong Kong SAR, ChinaHungaryIBRD onlyIcelandIDA & IBRD totalIDA blendIDA onlyIDA totalIndiaIndonesiaIran, Islamic Rep.IraqIrelandIsraelItalyJamaicaJapanJordanKazakhstanKenyaKorea, Rep.KosovoKuwaitKyrgyz RepublicLao PDRLate-demographic dividendLatin America & Caribbean Latin America & Caribbean (excluding high income)Latin America & the Caribbean (IDA & IBRD countries)LatviaLeast developed countries: UN classificationLebanonLesothoLiberiaLibyaLithuaniaLow & middle incomeLow incomeLower middle incomeLuxembourgMacao SAR, ChinaMacedonia, FYRMadagascarMalawiMalaysiaMaldivesMaliMaltaMauritaniaMauritiusMexicoMicronesia, Fed. Sts.Middle East & North AfricaMiddle East & North Africa (excluding high income)Middle East & North Africa (IDA & IBRD countries)Middle incomeMoldovaMongoliaMontenegroMoroccoMozambiqueMyanmarNamibiaNepalNetherlandsNew ZealandNicaraguaNigerNigeriaNorth AmericaNorwayOECD membersOmanOther small statesPacific island small statesPakistanPanamaPapua New GuineaParaguayPeruPhilippinesPolandPortugalPost-demographic dividendPre-demographic dividendQatarRomaniaRussian FederationRwandaSamoaSao Tome and PrincipeSaudi ArabiaSenegalSerbiaSeychellesSierra LeoneSingaporeSlovak RepublicSloveniaSmall statesSolomon IslandsSouth AfricaSouth AsiaSouth Asia (IDA & IBRD)South SudanSpainSri LankaSt. Kitts and NevisSt. LuciaSt. Vincent and the GrenadinesSub-Saharan Africa Sub-Saharan Africa (excluding high income)Sub-Saharan Africa (IDA & IBRD countries)SudanSurinameSwazilandSwedenSwitzerlandSyrian Arab RepublicTajikistanTanzaniaThailandTimor-LesteTogoTongaTrinidad and TobagoTunisiaTurkeyUgandaUkraineUnited Arab EmiratesUnited KingdomUnited StatesUpper middle incomeUruguayVanuatuVenezuela, RBVietnamWest Bank and GazaWorldYemen, Rep.ZambiaZimbabwe Timeline:
This timeline shows a graph from 1978 to 2016 of Grenada. No data until 1977. Number of actual observations by date: 39.
Source name:
World Development Indicators
Source organization:
International Monetary Fund, International Financial Statistics and data files, and World Bank and OECD GDP estimates.
Categories, topics:
Financial Sector
Last updated:
apr 23, 2017
Indicators value changes by year
Minimum:
27.337
jan 1, 1985
Maximum:
84.877
jan 1, 2012
At the date of observation
Value
Absolute change
Change from previous value
jan 1, 1978
35.301
+35.301
0.0%
jan 1, 1979
32.919
-2.382
-6.75%
jan 1, 1980
30.427
-2.492
-7.57%
jan 1, 1981
32.041
+1.615
5.31%
jan 1, 1982
31.65
-0.391
-1.22%
jan 1, 1983
30.646
-1.005
-3.17%
jan 1, 1984
27.872
-2.773
-9.05%
jan 1, 1985
27.337
-0.535
-1.92%
jan 1, 1986
31.681
+4.344
15.89%
jan 1, 1987
39.107
+7.426
23.44%
jan 1, 1988
41.801
+2.693
6.89%
jan 1, 1989
42.691
+0.89
2.13%
jan 1, 1990
47.453
+4.762
11.16%
jan 1, 1991
45.359
-2.094
-4.41%
jan 1, 1992
44.082
-1.277
-2.82%
jan 1, 1993
46.499
+2.417
5.48%
jan 1, 1994
61.217
+14.717
31.65%
jan 1, 1995
58.659
-2.558
-4.18%
jan 1, 1996
58.617
-0.041
-0.07%
jan 1, 1997
62.254
+3.636
6.2%
jan 1, 1998
71.41
+9.157
14.71%
jan 1, 1999
74.405
+2.995
4.19%
jan 1, 2000
74.914
+0.509
0.68%
jan 1, 2001
62.558
-12.356
-16.49%
jan 1, 2002
63.081
+0.522
0.84%
jan 1, 2003
61.432
-1.648
-2.61%
jan 1, 2004
58.465
-2.968
-4.83%
jan 1, 2005
61.618
+3.153
5.39%
jan 1, 2006
57.967
-3.651
-5.93%
jan 1, 2007
64.894
+6.927
11.95%
jan 1, 2008
68.808
+3.915
6.03%
jan 1, 2009
70.081
+1.273
1.85%
jan 1, 2010
79.377
+9.296
13.26%
jan 1, 2011
83.98
+4.603
5.8%
jan 1, 2012
84.877
+0.897
1.07%
jan 1, 2013
82.805
-2.072
-2.44%
jan 1, 2014
74.261
-8.544
-10.32%
jan 1, 2015
65.207
-9.053
-12.19%
jan 1, 2016
58.075
-7.133
-10.94%
Ranking of countries by current statistics by years


Comments: