29
/
en
AIzaSyAYiBZKx7MnpbEhh9jyipgxe19OcubqV5w
April 1, 2024
104727
Chile
CHL
true
2
1
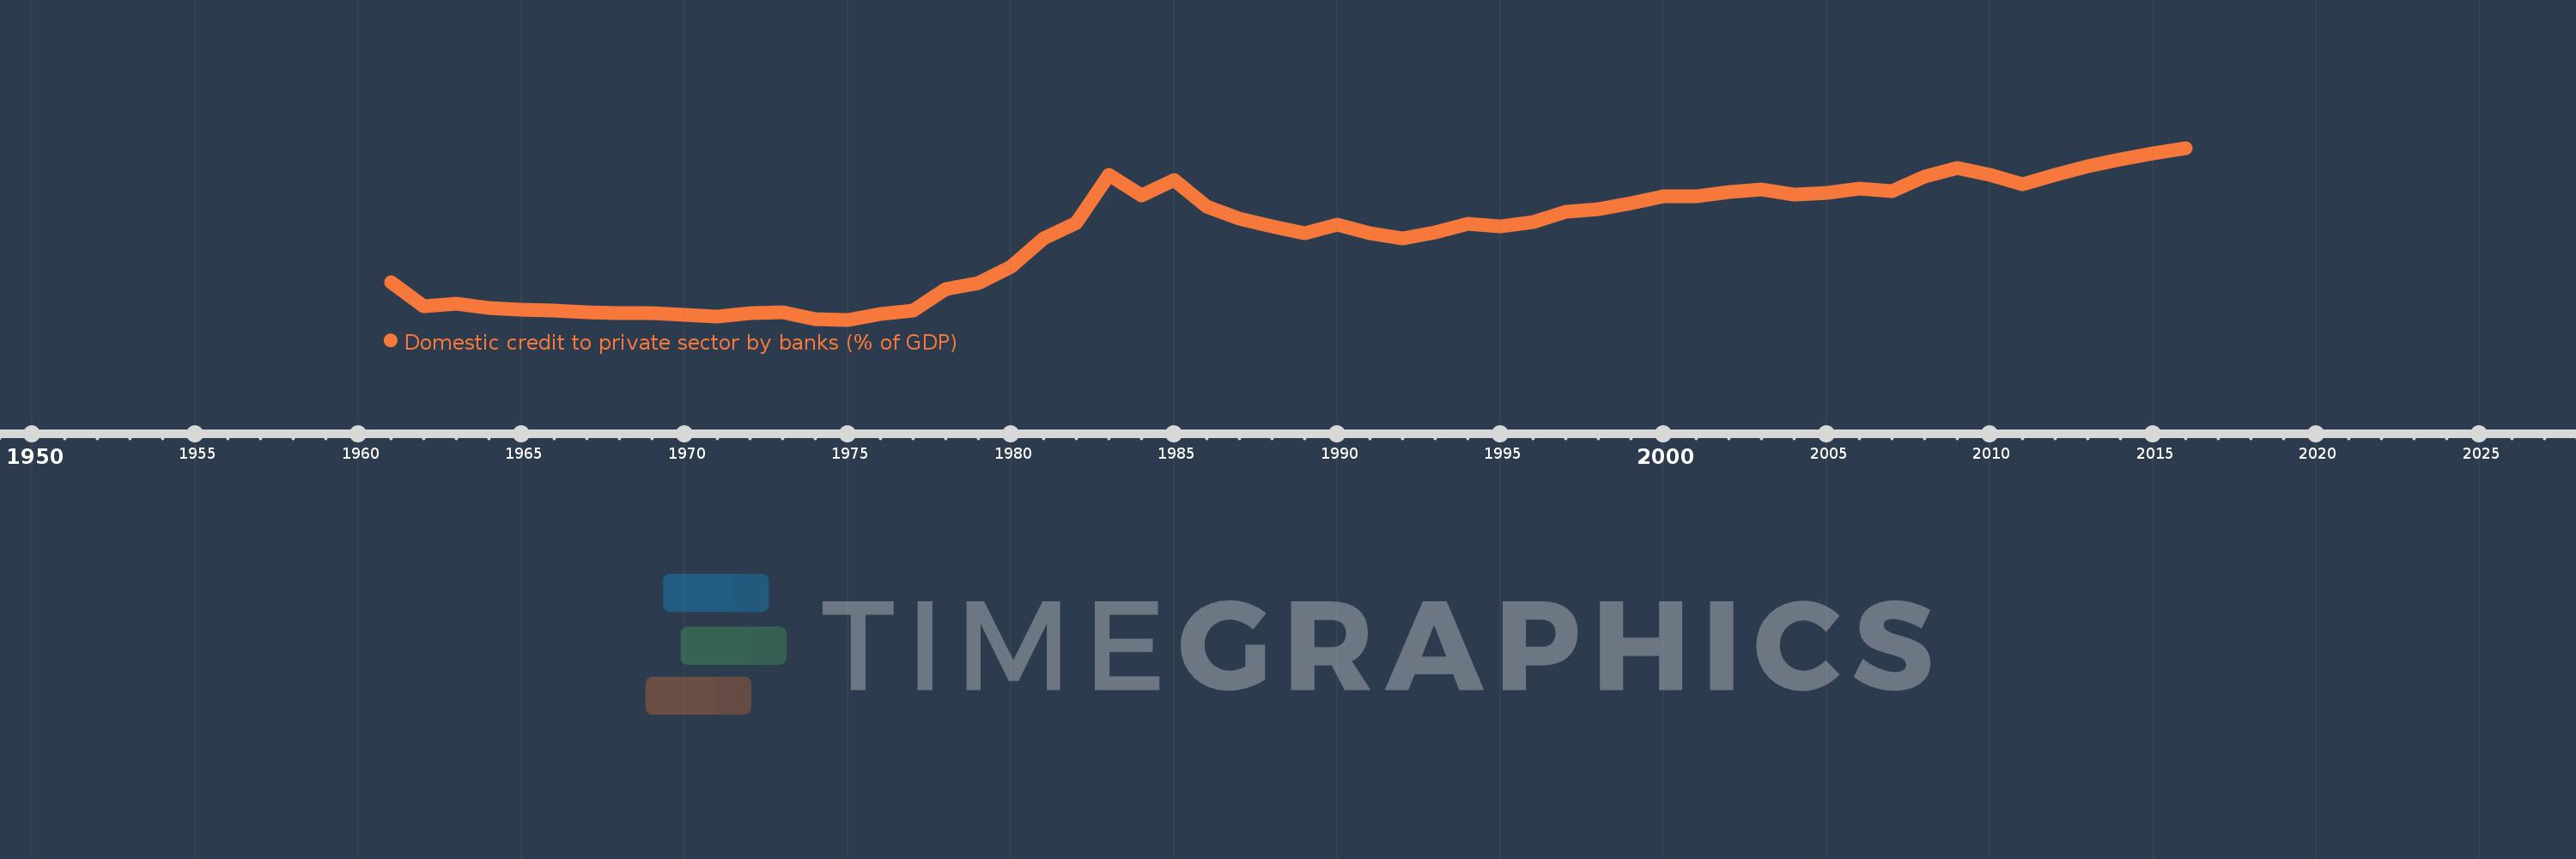
Domestic credit to private sector by banks (% of GDP)
2016,2015,2014,2013,2012,2011,2010,2009,2008,2007,2006,2005,2004,2003,2002,2001,2000,1999,1998,1997,1996,1995,1994,1993,1992,1991,1990,1989,1988,1987,1986,1985,1984,1983,1982,1981,1980,1979,1978,1977,1976,1975,1974,1973,1972,1971,1970,1969,1968,1967,1966,1965,1964,1963,1962,1961
This statistics in other country:
AfghanistanAlbaniaAlgeriaAngolaAntigua and BarbudaArab WorldArgentinaArmeniaArubaAustraliaAustriaAzerbaijanBahamas, TheBahrainBangladeshBarbadosBelarusBelgiumBelizeBeninBhutanBoliviaBosnia and HerzegovinaBotswanaBrazilBrunei DarussalamBulgariaBurkina FasoBurundiCabo VerdeCambodiaCameroonCanadaCaribbean small statesCentral African RepublicCentral Europe and the BalticsChadChileChinaColombiaComorosCongo, Dem. Rep.Congo, Rep.Costa RicaCote d'IvoireCroatiaCyprusCzech RepublicDenmarkDjiboutiDominicaDominican RepublicEarly-demographic dividendEast Asia & PacificEast Asia & Pacific (excluding high income)East Asia & Pacific (IDA & IBRD countries)EcuadorEgypt, Arab Rep.El SalvadorEquatorial GuineaEritreaEstoniaEthiopiaEuro areaEurope & Central AsiaEurope & Central Asia (excluding high income)Europe & Central Asia (IDA & IBRD countries)European UnionFijiFinlandFragile and conflict affected situationsFranceGabonGambia, TheGeorgiaGermanyGhanaGreeceGrenadaGuatemalaGuineaGuinea-BissauGuyanaHaitiHeavily indebted poor countries (HIPC)High incomeHondurasHong Kong SAR, ChinaHungaryIBRD onlyIcelandIDA & IBRD totalIDA blendIDA onlyIDA totalIndiaIndonesiaIran, Islamic Rep.IraqIrelandIsraelItalyJamaicaJapanJordanKazakhstanKenyaKorea, Rep.KosovoKuwaitKyrgyz RepublicLao PDRLate-demographic dividendLatin America & Caribbean Latin America & Caribbean (excluding high income)Latin America & the Caribbean (IDA & IBRD countries)LatviaLeast developed countries: UN classificationLebanonLesothoLiberiaLibyaLithuaniaLow & middle incomeLow incomeLower middle incomeLuxembourgMacao SAR, ChinaMacedonia, FYRMadagascarMalawiMalaysiaMaldivesMaliMaltaMauritaniaMauritiusMexicoMicronesia, Fed. Sts.Middle East & North AfricaMiddle East & North Africa (excluding high income)Middle East & North Africa (IDA & IBRD countries)Middle incomeMoldovaMongoliaMontenegroMoroccoMozambiqueMyanmarNamibiaNepalNetherlandsNew ZealandNicaraguaNigerNigeriaNorth AmericaNorwayOECD membersOmanOther small statesPacific island small statesPakistanPanamaPapua New GuineaParaguayPeruPhilippinesPolandPortugalPost-demographic dividendPre-demographic dividendQatarRomaniaRussian FederationRwandaSamoaSao Tome and PrincipeSaudi ArabiaSenegalSerbiaSeychellesSierra LeoneSingaporeSlovak RepublicSloveniaSmall statesSolomon IslandsSouth AfricaSouth AsiaSouth Asia (IDA & IBRD)South SudanSpainSri LankaSt. Kitts and NevisSt. LuciaSt. Vincent and the GrenadinesSub-Saharan Africa Sub-Saharan Africa (excluding high income)Sub-Saharan Africa (IDA & IBRD countries)SudanSurinameSwazilandSwedenSwitzerlandSyrian Arab RepublicTajikistanTanzaniaThailandTimor-LesteTogoTongaTrinidad and TobagoTunisiaTurkeyUgandaUkraineUnited Arab EmiratesUnited KingdomUnited StatesUpper middle incomeUruguayVanuatuVenezuela, RBVietnamWest Bank and GazaWorldYemen, Rep.ZambiaZimbabwe Timeline:
This timeline shows a graph from 1961 to 2016 of Chile. No data until 1960. Number of actual observations by date: 56.
Source name:
World Development Indicators
Source organization:
International Monetary Fund, International Financial Statistics and data files, and World Bank and OECD GDP estimates.
Categories, topics:
Financial Sector
Last updated:
apr 23, 2017
Indicators value changes by year
Maximum:
81.718
jan 1, 2016
At the date of observation
Value
Absolute change
Change from previous value
jan 1, 1961
22.443
+22.443
0.0%
jan 1, 1962
11.76
-10.682
-47.6%
jan 1, 1963
13.046
+1.285
10.93%
jan 1, 1964
10.882
-2.164
-16.59%
jan 1, 1965
10.162
-0.72
-6.62%
jan 1, 1966
9.864
-0.298
-2.93%
jan 1, 1967
9.034
-0.83
-8.42%
jan 1, 1968
8.936
-0.098
-1.09%
jan 1, 1969
8.931
-0.004
-0.05%
jan 1, 1970
7.936
-0.995
-11.14%
jan 1, 1971
7.352
-0.584
-7.36%
jan 1, 1972
8.788
+1.436
19.53%
jan 1, 1973
9.281
+0.493
5.61%
jan 1, 1974
5.954
-3.327
-35.85%
jan 1, 1975
5.874
-0.08
-1.34%
jan 1, 1976
8.322
+2.448
41.67%
jan 1, 1977
9.984
+1.663
19.98%
jan 1, 1978
19.287
+9.303
93.17%
jan 1, 1979
21.974
+2.687
13.93%
jan 1, 1980
29.447
+7.473
34.01%
jan 1, 1981
41.773
+12.326
41.86%
jan 1, 1982
48.463
+6.69
16.02%
jan 1, 1983
69.852
+21.389
44.13%
jan 1, 1984
60.625
-9.227
-13.21%
jan 1, 1985
67.686
+7.061
11.65%
jan 1, 1986
55.842
-11.844
-17.5%
jan 1, 1987
50.625
-5.216
-9.34%
jan 1, 1988
47.254
-3.372
-6.66%
jan 1, 1989
44.153
-3.101
-6.56%
jan 1, 1990
47.723
+3.57
8.09%
jan 1, 1991
44.196
-3.527
-7.39%
jan 1, 1992
41.643
-2.552
-5.77%
jan 1, 1993
44.296
+2.653
6.37%
jan 1, 1994
48.371
+4.075
9.2%
jan 1, 1995
47.263
-1.107
-2.29%
jan 1, 1996
49.0
+1.737
3.67%
jan 1, 1997
53.382
+4.382
8.94%
jan 1, 1998
54.709
+1.326
2.48%
jan 1, 1999
57.251
+2.543
4.65%
jan 1, 2000
60.207
+2.956
5.16%
jan 1, 2001
60.467
+0.26
0.43%
jan 1, 2002
62.193
+1.725
2.85%
jan 1, 2003
63.344
+1.151
1.85%
jan 1, 2004
61.149
-2.195
-3.46%
jan 1, 2005
62.026
+0.877
1.43%
jan 1, 2006
63.596
+1.57
2.53%
jan 1, 2007
62.727
-0.87
-1.37%
jan 1, 2008
69.05
+6.324
10.08%
jan 1, 2009
72.896
+3.846
5.57%
jan 1, 2010
69.739
-3.157
-4.33%
jan 1, 2011
65.712
-4.027
-5.77%
jan 1, 2012
69.862
+4.15
6.32%
jan 1, 2013
73.512
+3.65
5.23%
jan 1, 2014
76.547
+3.035
4.13%
jan 1, 2015
79.165
+2.617
3.42%
jan 1, 2016
81.718
+2.553
3.22%
Ranking of countries by current statistics by years


Comments: