29
/
en
AIzaSyAYiBZKx7MnpbEhh9jyipgxe19OcubqV5w
April 1, 2024
41351
Latin America & Caribbean
LCN
false
2
1
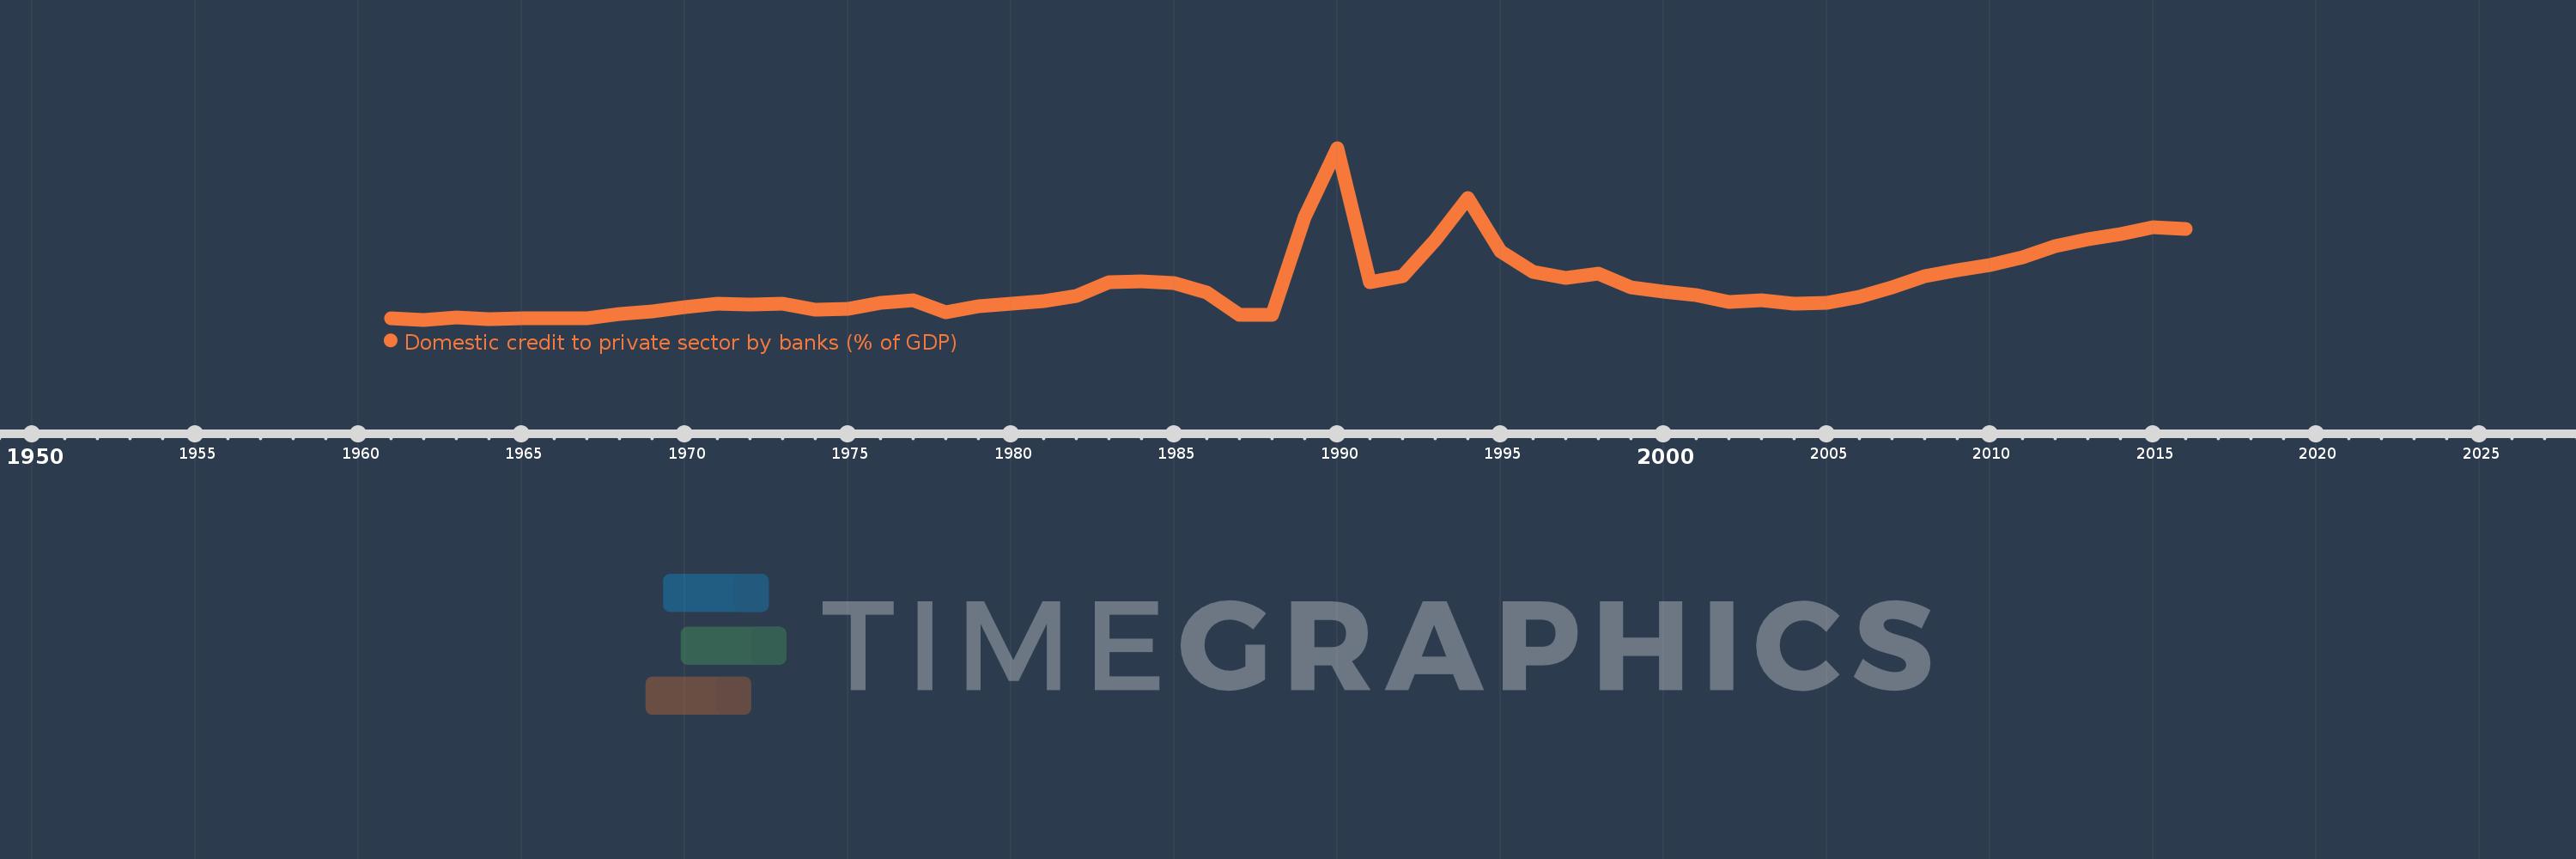
Domestic credit to private sector by banks (% of GDP)
2016,2015,2014,2013,2012,2011,2010,2009,2008,2007,2006,2005,2004,2003,2002,2001,2000,1999,1998,1997,1996,1995,1994,1993,1992,1991,1990,1989,1988,1987,1986,1985,1984,1983,1982,1981,1980,1979,1978,1977,1976,1975,1974,1973,1972,1971,1970,1969,1968,1967,1966,1965,1964,1963,1962,1961
This statistics in other country:
AfghanistanAlbaniaAlgeriaAngolaAntigua and BarbudaArab WorldArgentinaArmeniaArubaAustraliaAustriaAzerbaijanBahamas, TheBahrainBangladeshBarbadosBelarusBelgiumBelizeBeninBhutanBoliviaBosnia and HerzegovinaBotswanaBrazilBrunei DarussalamBulgariaBurkina FasoBurundiCabo VerdeCambodiaCameroonCanadaCaribbean small statesCentral African RepublicCentral Europe and the BalticsChadChileChinaColombiaComorosCongo, Dem. Rep.Congo, Rep.Costa RicaCote d'IvoireCroatiaCyprusCzech RepublicDenmarkDjiboutiDominicaDominican RepublicEarly-demographic dividendEast Asia & PacificEast Asia & Pacific (excluding high income)East Asia & Pacific (IDA & IBRD countries)EcuadorEgypt, Arab Rep.El SalvadorEquatorial GuineaEritreaEstoniaEthiopiaEuro areaEurope & Central AsiaEurope & Central Asia (excluding high income)Europe & Central Asia (IDA & IBRD countries)European UnionFijiFinlandFragile and conflict affected situationsFranceGabonGambia, TheGeorgiaGermanyGhanaGreeceGrenadaGuatemalaGuineaGuinea-BissauGuyanaHaitiHeavily indebted poor countries (HIPC)High incomeHondurasHong Kong SAR, ChinaHungaryIBRD onlyIcelandIDA & IBRD totalIDA blendIDA onlyIDA totalIndiaIndonesiaIran, Islamic Rep.IraqIrelandIsraelItalyJamaicaJapanJordanKazakhstanKenyaKorea, Rep.KosovoKuwaitKyrgyz RepublicLao PDRLate-demographic dividendLatin America & Caribbean Latin America & Caribbean (excluding high income)Latin America & the Caribbean (IDA & IBRD countries)LatviaLeast developed countries: UN classificationLebanonLesothoLiberiaLibyaLithuaniaLow & middle incomeLow incomeLower middle incomeLuxembourgMacao SAR, ChinaMacedonia, FYRMadagascarMalawiMalaysiaMaldivesMaliMaltaMauritaniaMauritiusMexicoMicronesia, Fed. Sts.Middle East & North AfricaMiddle East & North Africa (excluding high income)Middle East & North Africa (IDA & IBRD countries)Middle incomeMoldovaMongoliaMontenegroMoroccoMozambiqueMyanmarNamibiaNepalNetherlandsNew ZealandNicaraguaNigerNigeriaNorth AmericaNorwayOECD membersOmanOther small statesPacific island small statesPakistanPanamaPapua New GuineaParaguayPeruPhilippinesPolandPortugalPost-demographic dividendPre-demographic dividendQatarRomaniaRussian FederationRwandaSamoaSao Tome and PrincipeSaudi ArabiaSenegalSerbiaSeychellesSierra LeoneSingaporeSlovak RepublicSloveniaSmall statesSolomon IslandsSouth AfricaSouth AsiaSouth Asia (IDA & IBRD)South SudanSpainSri LankaSt. Kitts and NevisSt. LuciaSt. Vincent and the GrenadinesSub-Saharan Africa Sub-Saharan Africa (excluding high income)Sub-Saharan Africa (IDA & IBRD countries)SudanSurinameSwazilandSwedenSwitzerlandSyrian Arab RepublicTajikistanTanzaniaThailandTimor-LesteTogoTongaTrinidad and TobagoTunisiaTurkeyUgandaUkraineUnited Arab EmiratesUnited KingdomUnited StatesUpper middle incomeUruguayVanuatuVenezuela, RBVietnamWest Bank and GazaWorldYemen, Rep.ZambiaZimbabwe Timeline:
This timeline shows a graph from 1961 to 2016 of Latin America & Caribbean . No data until 1960. Number of actual observations by date: 56.
Source name:
World Development Indicators
Source organization:
International Monetary Fund, International Financial Statistics and data files, and World Bank and OECD GDP estimates.
Categories, topics:
Financial Sector
Last updated:
apr 23, 2017
Indicators value changes by year
Minimum:
16.723
jan 1, 1962
Maximum:
72.332
jan 1, 1990
At the date of observation
Value
Absolute change
Change from previous value
jan 1, 1961
17.291
+17.291
0.0%
jan 1, 1962
16.723
-0.568
-3.28%
jan 1, 1963
17.441
+0.718
4.29%
jan 1, 1964
16.95
-0.491
-2.81%
jan 1, 1965
17.314
+0.363
2.14%
jan 1, 1966
17.175
-0.139
-0.8%
jan 1, 1967
17.244
+0.069
0.4%
jan 1, 1968
18.457
+1.213
7.03%
jan 1, 1969
19.346
+0.89
4.82%
jan 1, 1970
20.726
+1.379
7.13%
jan 1, 1971
21.831
+1.105
5.33%
jan 1, 1972
21.755
-0.076
-0.35%
jan 1, 1973
21.802
+0.047
0.22%
jan 1, 1974
20.079
-1.724
-7.91%
jan 1, 1975
20.331
+0.252
1.26%
jan 1, 1976
22.093
+1.763
8.67%
jan 1, 1977
22.928
+0.835
3.78%
jan 1, 1978
19.154
-3.774
-16.46%
jan 1, 1979
21.071
+1.917
10.01%
jan 1, 1980
21.854
+0.784
3.72%
jan 1, 1981
22.731
+0.876
4.01%
jan 1, 1982
24.304
+1.573
6.92%
jan 1, 1983
28.901
+4.598
18.92%
jan 1, 1984
29.191
+0.29
1.0%
jan 1, 1985
28.659
-0.532
-1.82%
jan 1, 1986
25.663
-2.995
-10.45%
jan 1, 1987
18.243
-7.42
-28.91%
jan 1, 1988
18.248
+0.005
0.03%
jan 1, 1989
49.963
+31.714
173.79%
jan 1, 1990
72.332
+22.369
44.77%
jan 1, 1991
28.973
-43.359
-59.94%
jan 1, 1992
30.701
+1.728
5.97%
jan 1, 1993
42.46
+11.758
38.3%
jan 1, 1994
56.011
+13.552
31.92%
jan 1, 1995
39.017
-16.994
-30.34%
jan 1, 1996
32.108
-6.91
-17.71%
jan 1, 1997
30.394
-1.714
-5.34%
jan 1, 1998
31.669
+1.275
4.2%
jan 1, 1999
27.106
-4.563
-14.41%
jan 1, 2000
25.739
-1.366
-5.04%
jan 1, 2001
24.758
-0.982
-3.81%
jan 1, 2002
22.603
-2.155
-8.7%
jan 1, 2003
22.965
+0.363
1.6%
jan 1, 2004
22.037
-0.929
-4.04%
jan 1, 2005
22.324
+0.287
1.3%
jan 1, 2006
24.203
+1.879
8.42%
jan 1, 2007
27.072
+2.869
11.86%
jan 1, 2008
30.854
+3.782
13.97%
jan 1, 2009
32.82
+1.966
6.37%
jan 1, 2010
34.451
+1.63
4.97%
jan 1, 2011
36.912
+2.461
7.14%
jan 1, 2012
40.666
+3.755
10.17%
jan 1, 2013
42.773
+2.107
5.18%
jan 1, 2014
44.419
+1.646
3.85%
jan 1, 2015
46.68
+2.261
5.09%
jan 1, 2016
46.103
-0.577
-1.24%
Ranking of countries by current statistics by years


Comments: