29
/
en
AIzaSyAYiBZKx7MnpbEhh9jyipgxe19OcubqV5w
April 1, 2024
232120
Samoa
WSM
true
2
1
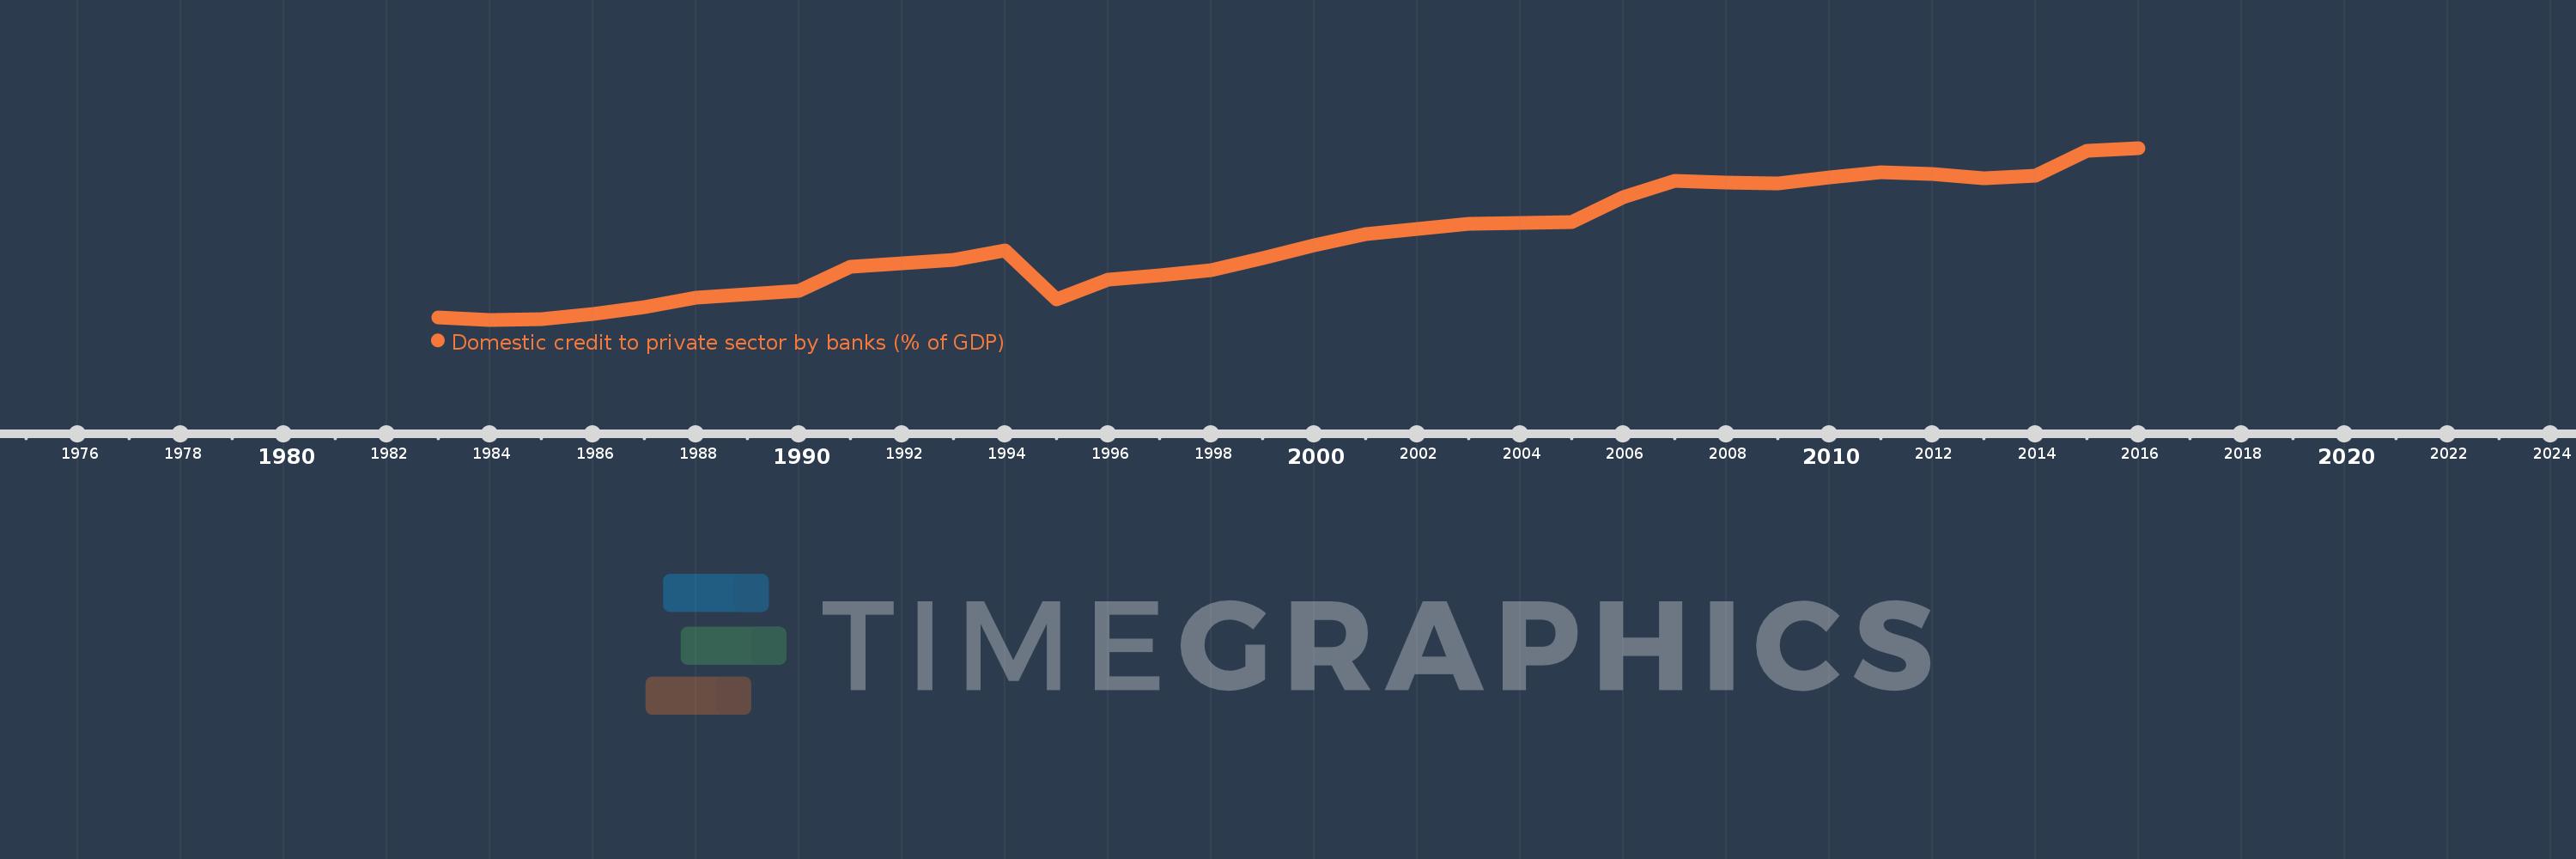
Domestic credit to private sector by banks (% of GDP)
2016,2015,2014,2013,2012,2011,2010,2009,2008,2007,2006,2005,2004,2003,2002,2001,2000,1999,1998,1997,1996,1995,1994,1993,1992,1991,1990,1989,1988,1987,1986,1985,1984,1983
This statistics in other country:
AfghanistanAlbaniaAlgeriaAngolaAntigua and BarbudaArab WorldArgentinaArmeniaArubaAustraliaAustriaAzerbaijanBahamas, TheBahrainBangladeshBarbadosBelarusBelgiumBelizeBeninBhutanBoliviaBosnia and HerzegovinaBotswanaBrazilBrunei DarussalamBulgariaBurkina FasoBurundiCabo VerdeCambodiaCameroonCanadaCaribbean small statesCentral African RepublicCentral Europe and the BalticsChadChileChinaColombiaComorosCongo, Dem. Rep.Congo, Rep.Costa RicaCote d'IvoireCroatiaCyprusCzech RepublicDenmarkDjiboutiDominicaDominican RepublicEarly-demographic dividendEast Asia & PacificEast Asia & Pacific (excluding high income)East Asia & Pacific (IDA & IBRD countries)EcuadorEgypt, Arab Rep.El SalvadorEquatorial GuineaEritreaEstoniaEthiopiaEuro areaEurope & Central AsiaEurope & Central Asia (excluding high income)Europe & Central Asia (IDA & IBRD countries)European UnionFijiFinlandFragile and conflict affected situationsFranceGabonGambia, TheGeorgiaGermanyGhanaGreeceGrenadaGuatemalaGuineaGuinea-BissauGuyanaHaitiHeavily indebted poor countries (HIPC)High incomeHondurasHong Kong SAR, ChinaHungaryIBRD onlyIcelandIDA & IBRD totalIDA blendIDA onlyIDA totalIndiaIndonesiaIran, Islamic Rep.IraqIrelandIsraelItalyJamaicaJapanJordanKazakhstanKenyaKorea, Rep.KosovoKuwaitKyrgyz RepublicLao PDRLate-demographic dividendLatin America & Caribbean Latin America & Caribbean (excluding high income)Latin America & the Caribbean (IDA & IBRD countries)LatviaLeast developed countries: UN classificationLebanonLesothoLiberiaLibyaLithuaniaLow & middle incomeLow incomeLower middle incomeLuxembourgMacao SAR, ChinaMacedonia, FYRMadagascarMalawiMalaysiaMaldivesMaliMaltaMauritaniaMauritiusMexicoMicronesia, Fed. Sts.Middle East & North AfricaMiddle East & North Africa (excluding high income)Middle East & North Africa (IDA & IBRD countries)Middle incomeMoldovaMongoliaMontenegroMoroccoMozambiqueMyanmarNamibiaNepalNetherlandsNew ZealandNicaraguaNigerNigeriaNorth AmericaNorwayOECD membersOmanOther small statesPacific island small statesPakistanPanamaPapua New GuineaParaguayPeruPhilippinesPolandPortugalPost-demographic dividendPre-demographic dividendQatarRomaniaRussian FederationRwandaSamoaSao Tome and PrincipeSaudi ArabiaSenegalSerbiaSeychellesSierra LeoneSingaporeSlovak RepublicSloveniaSmall statesSolomon IslandsSouth AfricaSouth AsiaSouth Asia (IDA & IBRD)South SudanSpainSri LankaSt. Kitts and NevisSt. LuciaSt. Vincent and the GrenadinesSub-Saharan Africa Sub-Saharan Africa (excluding high income)Sub-Saharan Africa (IDA & IBRD countries)SudanSurinameSwazilandSwedenSwitzerlandSyrian Arab RepublicTajikistanTanzaniaThailandTimor-LesteTogoTongaTrinidad and TobagoTunisiaTurkeyUgandaUkraineUnited Arab EmiratesUnited KingdomUnited StatesUpper middle incomeUruguayVanuatuVenezuela, RBVietnamWest Bank and GazaWorldYemen, Rep.ZambiaZimbabwe Timeline:
This timeline shows a graph from 1983 to 2016 of Samoa. No data until 1982. Number of actual observations by date: 34.
Source name:
World Development Indicators
Source organization:
International Monetary Fund, International Financial Statistics and data files, and World Bank and OECD GDP estimates.
Categories, topics:
Financial Sector
Last updated:
apr 23, 2017
Indicators value changes by year
Maximum:
45.135
jan 1, 2016
At the date of observation
Value
Absolute change
Change from previous value
jan 1, 1983
9.679
+9.679
0.0%
jan 1, 1984
9.197
-0.482
-4.98%
jan 1, 1985
9.364
+0.166
1.81%
jan 1, 1986
10.434
+1.07
11.43%
jan 1, 1987
11.79
+1.356
13.0%
jan 1, 1988
13.766
+1.976
16.76%
jan 1, 1989
14.446
+0.68
4.94%
jan 1, 1990
15.18
+0.734
5.08%
jan 1, 1991
20.247
+5.067
33.38%
jan 1, 1992
20.985
+0.738
3.64%
jan 1, 1993
21.734
+0.749
3.57%
jan 1, 1994
23.779
+2.045
9.41%
jan 1, 1995
13.469
-10.31
-43.36%
jan 1, 1996
17.509
+4.04
29.99%
jan 1, 1997
18.469
+0.96
5.49%
jan 1, 1998
19.621
+1.152
6.24%
jan 1, 1999
22.092
+2.471
12.59%
jan 1, 2000
24.839
+2.747
12.43%
jan 1, 2001
27.056
+2.218
8.93%
jan 1, 2002
28.255
+1.199
4.43%
jan 1, 2003
29.227
+0.972
3.44%
jan 1, 2004
29.463
+0.236
0.81%
jan 1, 2005
29.656
+0.192
0.65%
jan 1, 2006
34.787
+5.131
17.3%
jan 1, 2007
38.251
+3.464
9.96%
jan 1, 2008
37.819
-0.432
-1.13%
jan 1, 2009
37.786
-0.033
-0.09%
jan 1, 2010
38.913
+1.127
2.98%
jan 1, 2011
40.127
+1.214
3.12%
jan 1, 2012
39.681
-0.447
-1.11%
jan 1, 2013
38.726
-0.955
-2.41%
jan 1, 2014
39.375
+0.649
1.68%
jan 1, 2015
44.467
+5.092
12.93%
jan 1, 2016
45.135
+0.668
1.5%
Ranking of countries by current statistics by years


Comments: