29
/
en
AIzaSyAYiBZKx7MnpbEhh9jyipgxe19OcubqV5w
April 1, 2024
28998
East Asia & Pacific (IDA & IBRD countries)
TEA
false
2
1
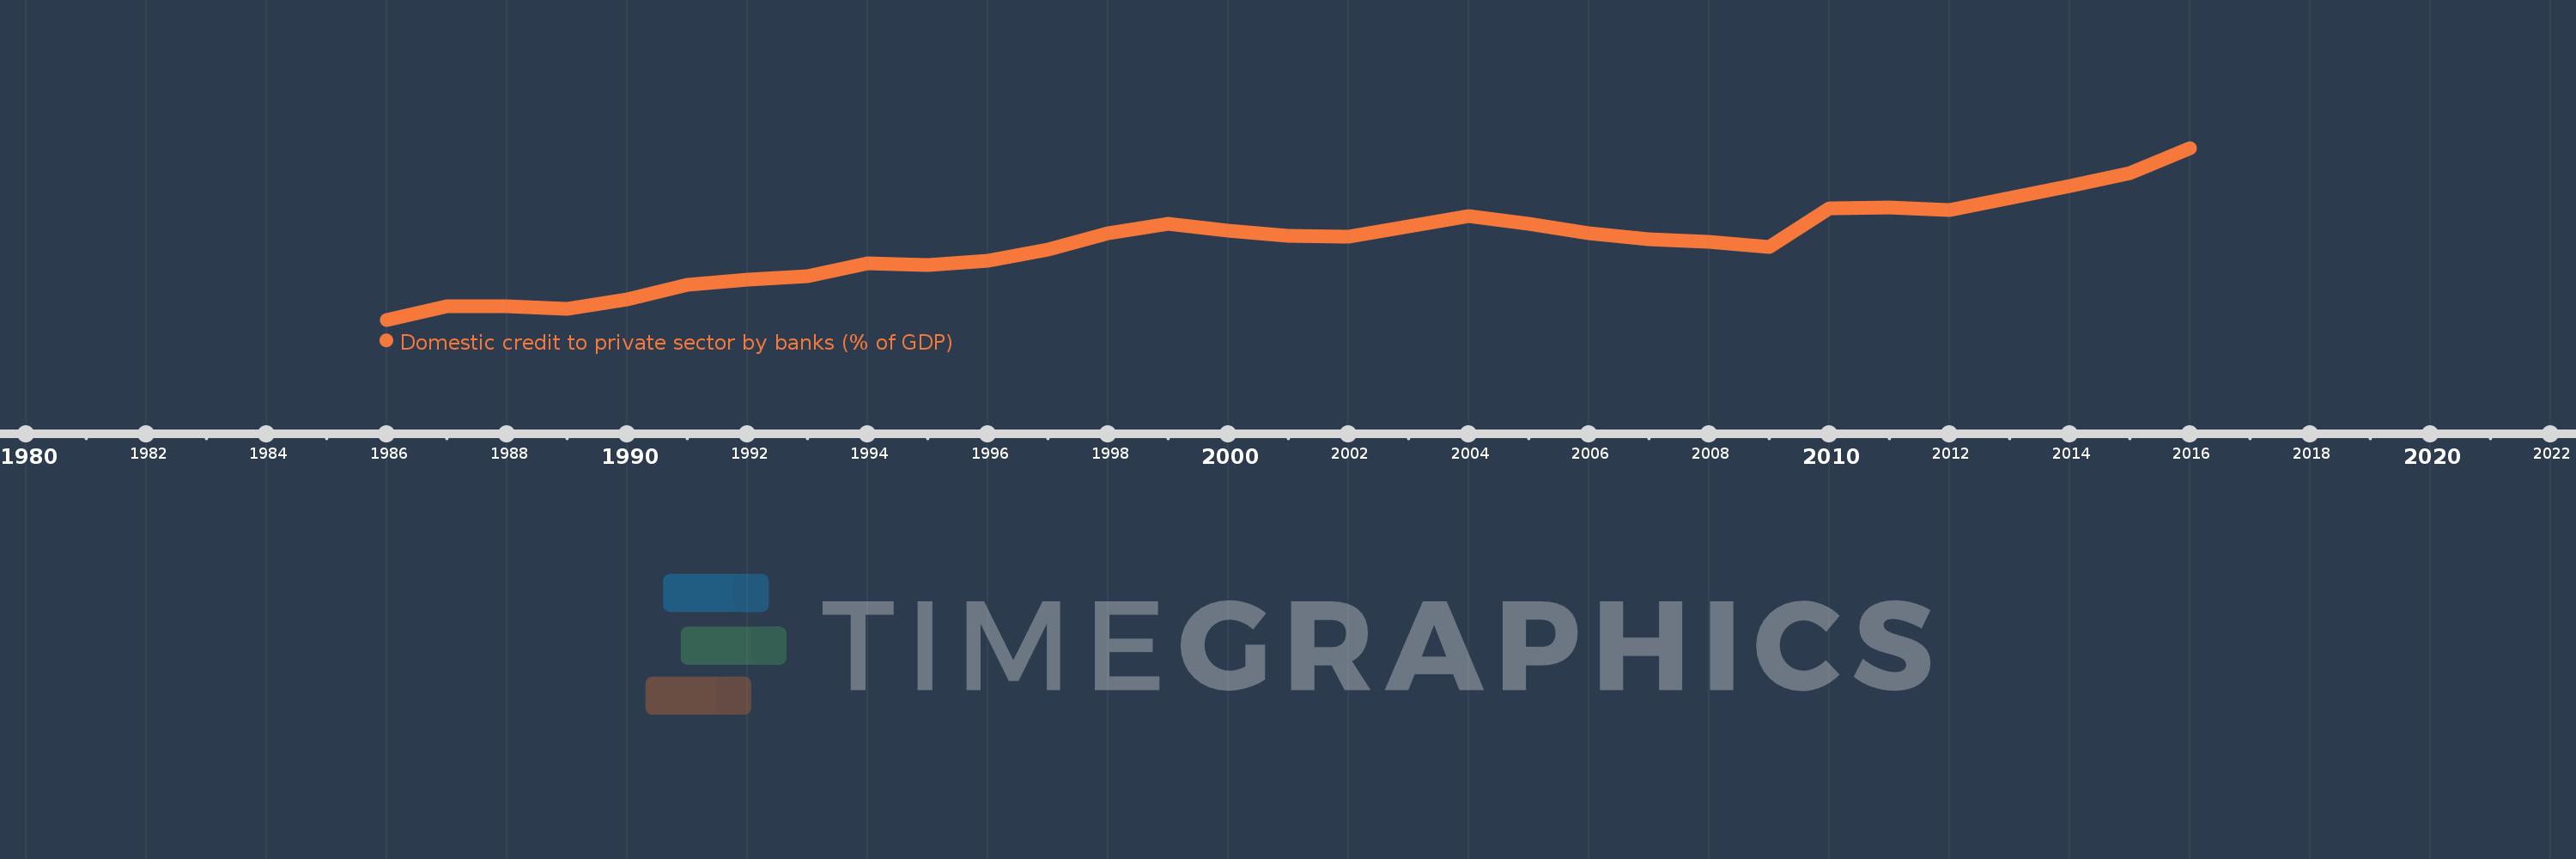
Domestic credit to private sector by banks (% of GDP)
2016,2015,2014,2013,2012,2011,2010,2009,2008,2007,2006,2005,2004,2003,2002,2001,2000,1999,1998,1997,1996,1995,1994,1993,1992,1991,1990,1989,1988,1987,1986
This statistics in other country:
AfghanistanAlbaniaAlgeriaAngolaAntigua and BarbudaArab WorldArgentinaArmeniaArubaAustraliaAustriaAzerbaijanBahamas, TheBahrainBangladeshBarbadosBelarusBelgiumBelizeBeninBhutanBoliviaBosnia and HerzegovinaBotswanaBrazilBrunei DarussalamBulgariaBurkina FasoBurundiCabo VerdeCambodiaCameroonCanadaCaribbean small statesCentral African RepublicCentral Europe and the BalticsChadChileChinaColombiaComorosCongo, Dem. Rep.Congo, Rep.Costa RicaCote d'IvoireCroatiaCyprusCzech RepublicDenmarkDjiboutiDominicaDominican RepublicEarly-demographic dividendEast Asia & PacificEast Asia & Pacific (excluding high income)East Asia & Pacific (IDA & IBRD countries)EcuadorEgypt, Arab Rep.El SalvadorEquatorial GuineaEritreaEstoniaEthiopiaEuro areaEurope & Central AsiaEurope & Central Asia (excluding high income)Europe & Central Asia (IDA & IBRD countries)European UnionFijiFinlandFragile and conflict affected situationsFranceGabonGambia, TheGeorgiaGermanyGhanaGreeceGrenadaGuatemalaGuineaGuinea-BissauGuyanaHaitiHeavily indebted poor countries (HIPC)High incomeHondurasHong Kong SAR, ChinaHungaryIBRD onlyIcelandIDA & IBRD totalIDA blendIDA onlyIDA totalIndiaIndonesiaIran, Islamic Rep.IraqIrelandIsraelItalyJamaicaJapanJordanKazakhstanKenyaKorea, Rep.KosovoKuwaitKyrgyz RepublicLao PDRLate-demographic dividendLatin America & Caribbean Latin America & Caribbean (excluding high income)Latin America & the Caribbean (IDA & IBRD countries)LatviaLeast developed countries: UN classificationLebanonLesothoLiberiaLibyaLithuaniaLow & middle incomeLow incomeLower middle incomeLuxembourgMacao SAR, ChinaMacedonia, FYRMadagascarMalawiMalaysiaMaldivesMaliMaltaMauritaniaMauritiusMexicoMicronesia, Fed. Sts.Middle East & North AfricaMiddle East & North Africa (excluding high income)Middle East & North Africa (IDA & IBRD countries)Middle incomeMoldovaMongoliaMontenegroMoroccoMozambiqueMyanmarNamibiaNepalNetherlandsNew ZealandNicaraguaNigerNigeriaNorth AmericaNorwayOECD membersOmanOther small statesPacific island small statesPakistanPanamaPapua New GuineaParaguayPeruPhilippinesPolandPortugalPost-demographic dividendPre-demographic dividendQatarRomaniaRussian FederationRwandaSamoaSao Tome and PrincipeSaudi ArabiaSenegalSerbiaSeychellesSierra LeoneSingaporeSlovak RepublicSloveniaSmall statesSolomon IslandsSouth AfricaSouth AsiaSouth Asia (IDA & IBRD)South SudanSpainSri LankaSt. Kitts and NevisSt. LuciaSt. Vincent and the GrenadinesSub-Saharan Africa Sub-Saharan Africa (excluding high income)Sub-Saharan Africa (IDA & IBRD countries)SudanSurinameSwazilandSwedenSwitzerlandSyrian Arab RepublicTajikistanTanzaniaThailandTimor-LesteTogoTongaTrinidad and TobagoTunisiaTurkeyUgandaUkraineUnited Arab EmiratesUnited KingdomUnited StatesUpper middle incomeUruguayVanuatuVenezuela, RBVietnamWest Bank and GazaWorldYemen, Rep.ZambiaZimbabwe Timeline:
This timeline shows a graph from 1986 to 2016 of East Asia & Pacific (IDA & IBRD countries). No data until 1985. Number of actual observations by date: 31.
Source name:
World Development Indicators
Source organization:
International Monetary Fund, International Financial Statistics and data files, and World Bank and OECD GDP estimates.
Categories, topics:
Financial Sector
Last updated:
apr 23, 2017
Indicators value changes by year
Maximum:
139.706
jan 1, 2016
At the date of observation
Value
Absolute change
Change from previous value
jan 1, 1986
55.23
+55.23
0.0%
jan 1, 1987
61.939
+6.71
12.15%
jan 1, 1988
62.028
+0.089
0.14%
jan 1, 1989
60.797
-1.231
-1.99%
jan 1, 1990
65.385
+4.588
7.55%
jan 1, 1991
72.528
+7.143
10.93%
jan 1, 1992
74.759
+2.231
3.08%
jan 1, 1993
76.674
+1.914
2.56%
jan 1, 1994
82.901
+6.227
8.12%
jan 1, 1995
82.125
-0.775
-0.94%
jan 1, 1996
84.141
+2.016
2.45%
jan 1, 1997
89.824
+5.683
6.75%
jan 1, 1998
97.856
+8.032
8.94%
jan 1, 1999
102.343
+4.487
4.59%
jan 1, 2000
99.135
-3.208
-3.13%
jan 1, 2001
96.474
-2.661
-2.68%
jan 1, 2002
96.24
-0.234
-0.24%
jan 1, 2003
101.007
+4.767
4.95%
jan 1, 2004
106.37
+5.363
5.31%
jan 1, 2005
102.457
-3.913
-3.68%
jan 1, 2006
97.736
-4.721
-4.61%
jan 1, 2007
94.938
-2.798
-2.86%
jan 1, 2008
93.373
-1.565
-1.65%
jan 1, 2009
91.137
-2.236
-2.39%
jan 1, 2010
110.051
+18.914
20.75%
jan 1, 2011
110.425
+0.374
0.34%
jan 1, 2012
109.007
-1.418
-1.28%
jan 1, 2013
114.989
+5.981
5.49%
jan 1, 2014
120.995
+6.007
5.22%
jan 1, 2015
127.411
+6.415
5.3%
jan 1, 2016
139.706
+12.295
9.65%
Ranking of countries by current statistics by years


Comments: