29
/
en
AIzaSyAYiBZKx7MnpbEhh9jyipgxe19OcubqV5w
April 1, 2024
144213
Guatemala
GTM
true
2
1
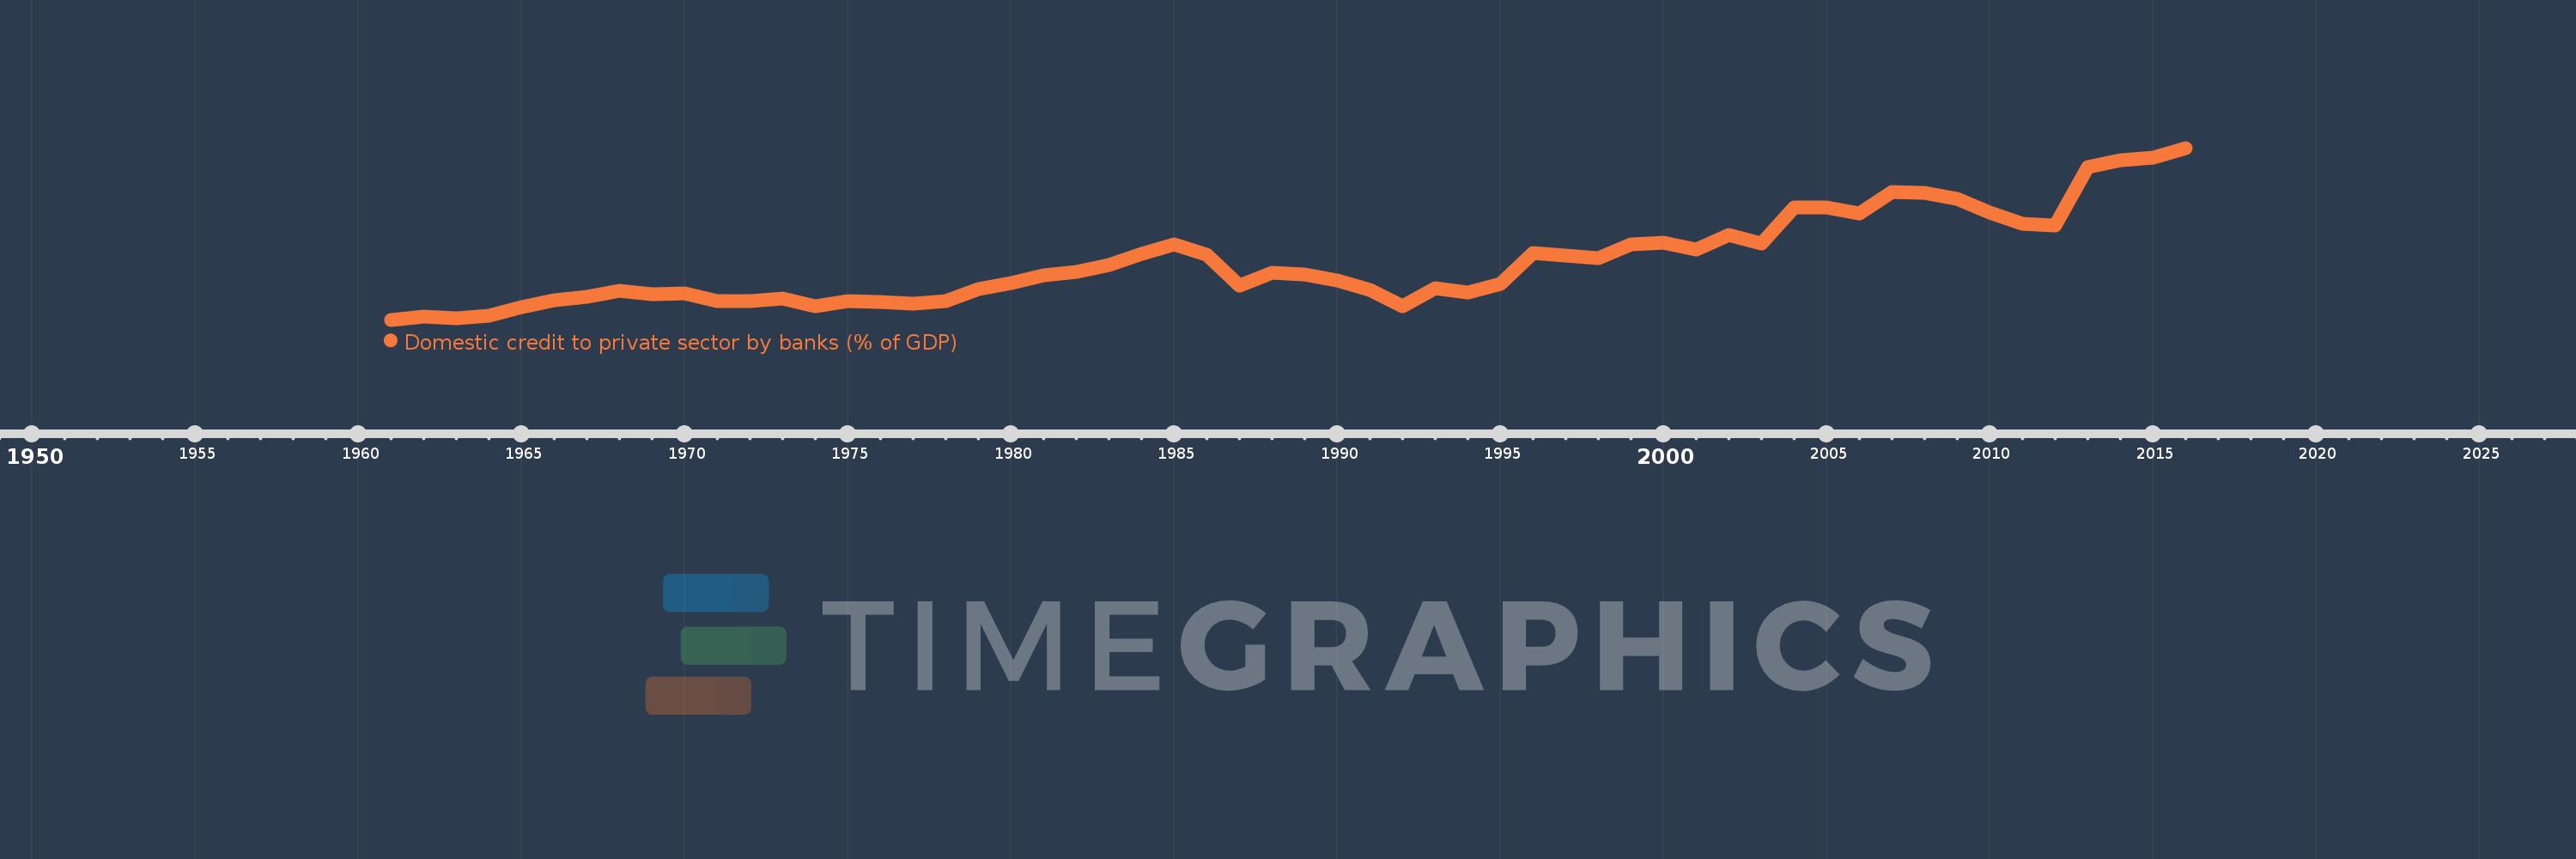
Domestic credit to private sector by banks (% of GDP)
2016,2015,2014,2013,2012,2011,2010,2009,2008,2007,2006,2005,2004,2003,2002,2001,2000,1999,1998,1997,1996,1995,1994,1993,1992,1991,1990,1989,1988,1987,1986,1985,1984,1983,1982,1981,1980,1979,1978,1977,1976,1975,1974,1973,1972,1971,1970,1969,1968,1967,1966,1965,1964,1963,1962,1961
This statistics in other country:
AfghanistanAlbaniaAlgeriaAngolaAntigua and BarbudaArab WorldArgentinaArmeniaArubaAustraliaAustriaAzerbaijanBahamas, TheBahrainBangladeshBarbadosBelarusBelgiumBelizeBeninBhutanBoliviaBosnia and HerzegovinaBotswanaBrazilBrunei DarussalamBulgariaBurkina FasoBurundiCabo VerdeCambodiaCameroonCanadaCaribbean small statesCentral African RepublicCentral Europe and the BalticsChadChileChinaColombiaComorosCongo, Dem. Rep.Congo, Rep.Costa RicaCote d'IvoireCroatiaCyprusCzech RepublicDenmarkDjiboutiDominicaDominican RepublicEarly-demographic dividendEast Asia & PacificEast Asia & Pacific (excluding high income)East Asia & Pacific (IDA & IBRD countries)EcuadorEgypt, Arab Rep.El SalvadorEquatorial GuineaEritreaEstoniaEthiopiaEuro areaEurope & Central AsiaEurope & Central Asia (excluding high income)Europe & Central Asia (IDA & IBRD countries)European UnionFijiFinlandFragile and conflict affected situationsFranceGabonGambia, TheGeorgiaGermanyGhanaGreeceGrenadaGuatemalaGuineaGuinea-BissauGuyanaHaitiHeavily indebted poor countries (HIPC)High incomeHondurasHong Kong SAR, ChinaHungaryIBRD onlyIcelandIDA & IBRD totalIDA blendIDA onlyIDA totalIndiaIndonesiaIran, Islamic Rep.IraqIrelandIsraelItalyJamaicaJapanJordanKazakhstanKenyaKorea, Rep.KosovoKuwaitKyrgyz RepublicLao PDRLate-demographic dividendLatin America & Caribbean Latin America & Caribbean (excluding high income)Latin America & the Caribbean (IDA & IBRD countries)LatviaLeast developed countries: UN classificationLebanonLesothoLiberiaLibyaLithuaniaLow & middle incomeLow incomeLower middle incomeLuxembourgMacao SAR, ChinaMacedonia, FYRMadagascarMalawiMalaysiaMaldivesMaliMaltaMauritaniaMauritiusMexicoMicronesia, Fed. Sts.Middle East & North AfricaMiddle East & North Africa (excluding high income)Middle East & North Africa (IDA & IBRD countries)Middle incomeMoldovaMongoliaMontenegroMoroccoMozambiqueMyanmarNamibiaNepalNetherlandsNew ZealandNicaraguaNigerNigeriaNorth AmericaNorwayOECD membersOmanOther small statesPacific island small statesPakistanPanamaPapua New GuineaParaguayPeruPhilippinesPolandPortugalPost-demographic dividendPre-demographic dividendQatarRomaniaRussian FederationRwandaSamoaSao Tome and PrincipeSaudi ArabiaSenegalSerbiaSeychellesSierra LeoneSingaporeSlovak RepublicSloveniaSmall statesSolomon IslandsSouth AfricaSouth AsiaSouth Asia (IDA & IBRD)South SudanSpainSri LankaSt. Kitts and NevisSt. LuciaSt. Vincent and the GrenadinesSub-Saharan Africa Sub-Saharan Africa (excluding high income)Sub-Saharan Africa (IDA & IBRD countries)SudanSurinameSwazilandSwedenSwitzerlandSyrian Arab RepublicTajikistanTanzaniaThailandTimor-LesteTogoTongaTrinidad and TobagoTunisiaTurkeyUgandaUkraineUnited Arab EmiratesUnited KingdomUnited StatesUpper middle incomeUruguayVanuatuVenezuela, RBVietnamWest Bank and GazaWorldYemen, Rep.ZambiaZimbabwe Timeline:
This timeline shows a graph from 1961 to 2016 of Guatemala. No data until 1960. Number of actual observations by date: 56.
Source name:
World Development Indicators
Source organization:
International Monetary Fund, International Financial Statistics and data files, and World Bank and OECD GDP estimates.
Categories, topics:
Financial Sector
Last updated:
apr 23, 2017
Indicators value changes by year
Maximum:
33.781
jan 1, 2016
At the date of observation
Value
Absolute change
Change from previous value
jan 1, 1961
10.08
+10.08
0.0%
jan 1, 1962
10.504
+0.424
4.2%
jan 1, 1963
10.24
-0.265
-2.52%
jan 1, 1964
10.619
+0.38
3.71%
jan 1, 1965
11.808
+1.189
11.2%
jan 1, 1966
12.806
+0.998
8.45%
jan 1, 1967
13.216
+0.41
3.2%
jan 1, 1968
14.131
+0.915
6.92%
jan 1, 1969
13.611
-0.521
-3.68%
jan 1, 1970
13.694
+0.083
0.61%
jan 1, 1971
12.694
-0.999
-7.3%
jan 1, 1972
12.651
-0.043
-0.34%
jan 1, 1973
12.949
+0.298
2.36%
jan 1, 1974
11.906
-1.043
-8.05%
jan 1, 1975
12.659
+0.752
6.32%
jan 1, 1976
12.529
-0.129
-1.02%
jan 1, 1977
12.267
-0.262
-2.09%
jan 1, 1978
12.619
+0.352
2.87%
jan 1, 1979
14.297
+1.677
13.29%
jan 1, 1980
15.116
+0.819
5.73%
jan 1, 1981
16.226
+1.11
7.34%
jan 1, 1982
16.668
+0.442
2.72%
jan 1, 1983
17.63
+0.962
5.77%
jan 1, 1984
19.221
+1.591
9.02%
jan 1, 1985
20.448
+1.227
6.38%
jan 1, 1986
19.093
-1.355
-6.62%
jan 1, 1987
14.842
-4.252
-22.27%
jan 1, 1988
16.518
+1.676
11.3%
jan 1, 1989
16.282
-0.236
-1.43%
jan 1, 1990
15.549
-0.733
-4.5%
jan 1, 1991
14.178
-1.372
-8.82%
jan 1, 1992
11.948
-2.229
-15.72%
jan 1, 1993
14.474
+2.525
21.13%
jan 1, 1994
13.891
-0.582
-4.02%
jan 1, 1995
15.016
+1.124
8.09%
jan 1, 1996
19.272
+4.256
28.34%
jan 1, 1997
18.959
-0.312
-1.62%
jan 1, 1998
18.533
-0.426
-2.25%
jan 1, 1999
20.522
+1.989
10.73%
jan 1, 2000
20.679
+0.156
0.76%
jan 1, 2001
19.766
-0.913
-4.42%
jan 1, 2002
21.746
+1.98
10.02%
jan 1, 2003
20.579
-1.166
-5.36%
jan 1, 2004
25.612
+5.032
24.45%
jan 1, 2005
25.584
-0.028
-0.11%
jan 1, 2006
24.728
-0.856
-3.34%
jan 1, 2007
27.742
+3.014
12.19%
jan 1, 2008
27.601
-0.141
-0.51%
jan 1, 2009
26.784
-0.817
-2.96%
jan 1, 2010
24.85
-1.934
-7.22%
jan 1, 2011
23.353
-1.497
-6.02%
jan 1, 2012
23.028
-0.325
-1.39%
jan 1, 2013
31.137
+8.11
35.22%
jan 1, 2014
32.052
+0.915
2.94%
jan 1, 2015
32.457
+0.404
1.26%
jan 1, 2016
33.781
+1.324
4.08%
Ranking of countries by current statistics by years


Comments: