29
/
en
AIzaSyAYiBZKx7MnpbEhh9jyipgxe19OcubqV5w
April 1, 2024
147828
Guyana
GUY
true
2
1
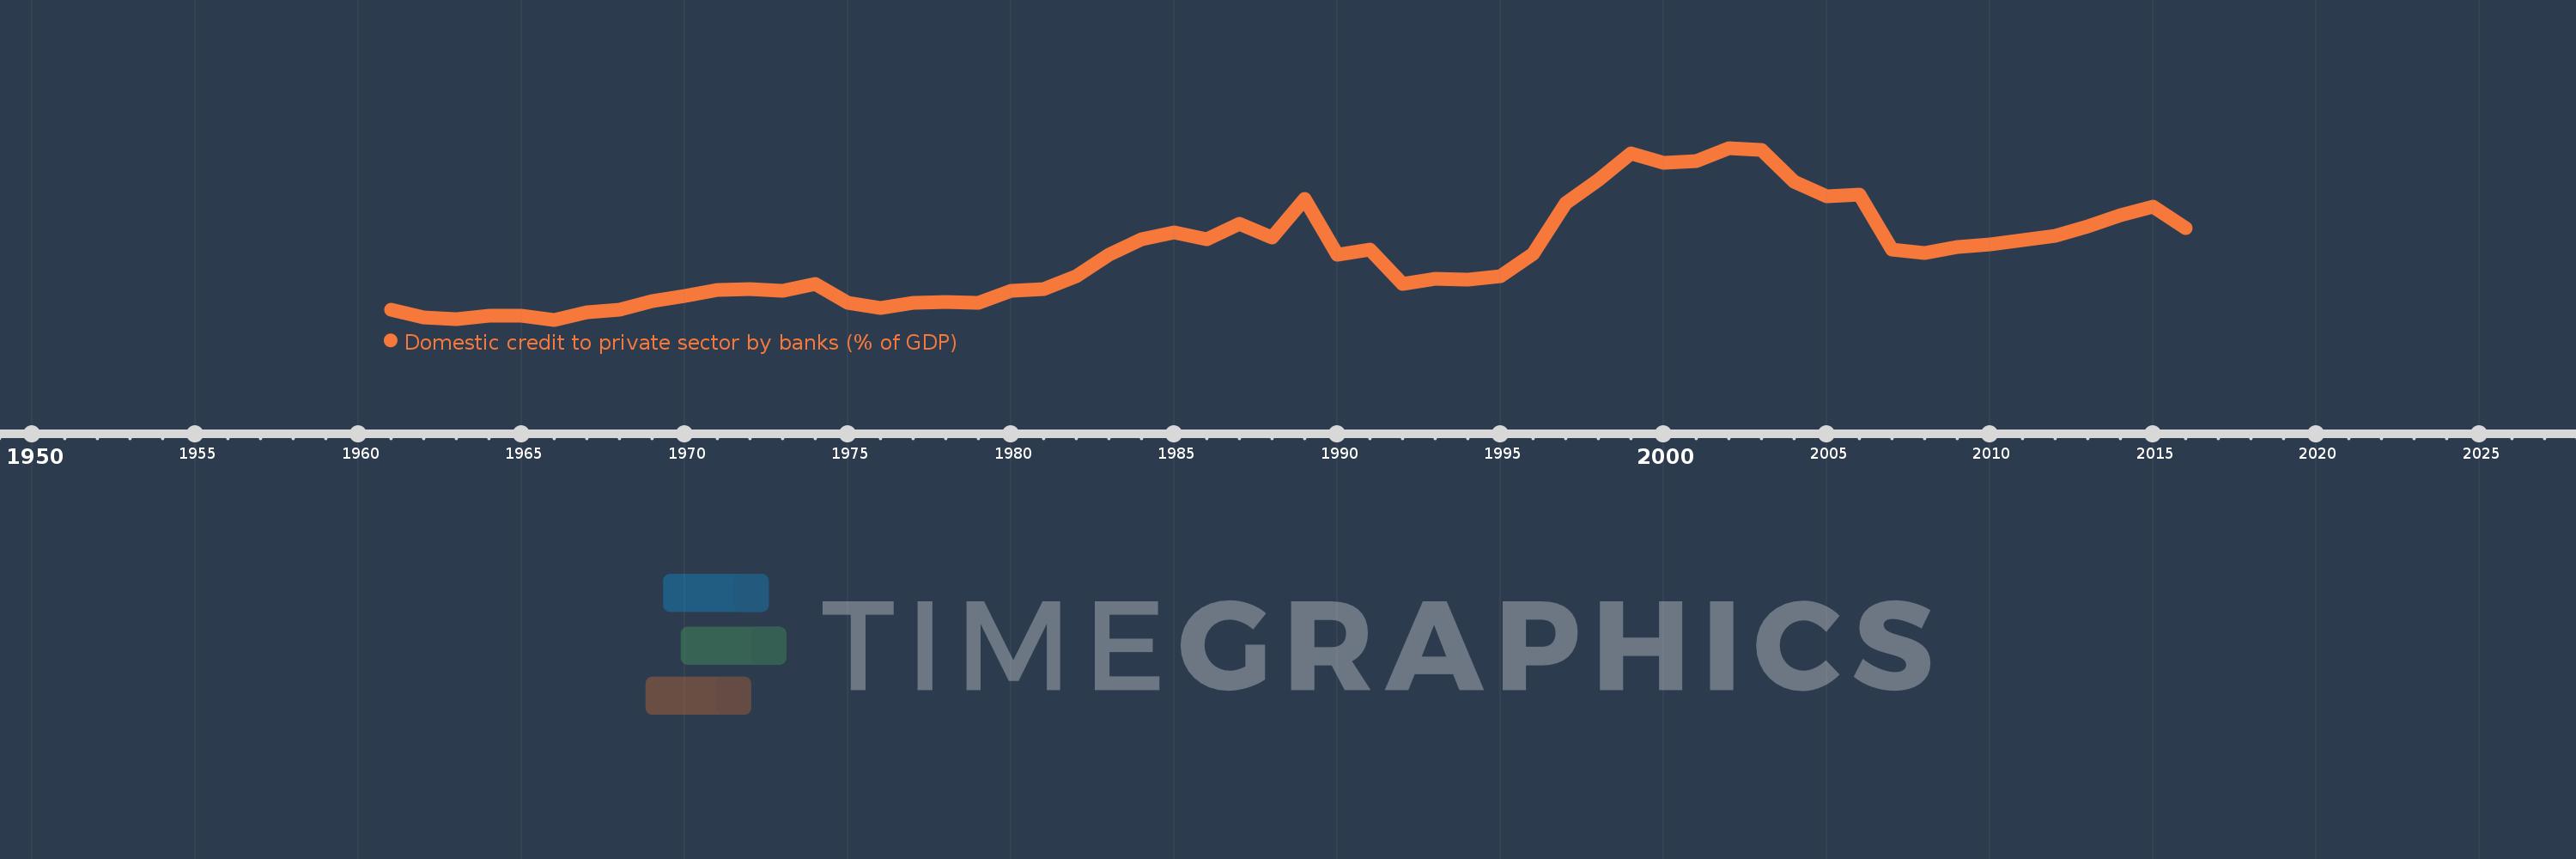
Domestic credit to private sector by banks (% of GDP)
2016,2015,2014,2013,2012,2011,2010,2009,2008,2007,2006,2005,2004,2003,2002,2001,2000,1999,1998,1997,1996,1995,1994,1993,1992,1991,1990,1989,1988,1987,1986,1985,1984,1983,1982,1981,1980,1979,1978,1977,1976,1975,1974,1973,1972,1971,1970,1969,1968,1967,1966,1965,1964,1963,1962,1961
This statistics in other country:
AfghanistanAlbaniaAlgeriaAngolaAntigua and BarbudaArab WorldArgentinaArmeniaArubaAustraliaAustriaAzerbaijanBahamas, TheBahrainBangladeshBarbadosBelarusBelgiumBelizeBeninBhutanBoliviaBosnia and HerzegovinaBotswanaBrazilBrunei DarussalamBulgariaBurkina FasoBurundiCabo VerdeCambodiaCameroonCanadaCaribbean small statesCentral African RepublicCentral Europe and the BalticsChadChileChinaColombiaComorosCongo, Dem. Rep.Congo, Rep.Costa RicaCote d'IvoireCroatiaCyprusCzech RepublicDenmarkDjiboutiDominicaDominican RepublicEarly-demographic dividendEast Asia & PacificEast Asia & Pacific (excluding high income)East Asia & Pacific (IDA & IBRD countries)EcuadorEgypt, Arab Rep.El SalvadorEquatorial GuineaEritreaEstoniaEthiopiaEuro areaEurope & Central AsiaEurope & Central Asia (excluding high income)Europe & Central Asia (IDA & IBRD countries)European UnionFijiFinlandFragile and conflict affected situationsFranceGabonGambia, TheGeorgiaGermanyGhanaGreeceGrenadaGuatemalaGuineaGuinea-BissauGuyanaHaitiHeavily indebted poor countries (HIPC)High incomeHondurasHong Kong SAR, ChinaHungaryIBRD onlyIcelandIDA & IBRD totalIDA blendIDA onlyIDA totalIndiaIndonesiaIran, Islamic Rep.IraqIrelandIsraelItalyJamaicaJapanJordanKazakhstanKenyaKorea, Rep.KosovoKuwaitKyrgyz RepublicLao PDRLate-demographic dividendLatin America & Caribbean Latin America & Caribbean (excluding high income)Latin America & the Caribbean (IDA & IBRD countries)LatviaLeast developed countries: UN classificationLebanonLesothoLiberiaLibyaLithuaniaLow & middle incomeLow incomeLower middle incomeLuxembourgMacao SAR, ChinaMacedonia, FYRMadagascarMalawiMalaysiaMaldivesMaliMaltaMauritaniaMauritiusMexicoMicronesia, Fed. Sts.Middle East & North AfricaMiddle East & North Africa (excluding high income)Middle East & North Africa (IDA & IBRD countries)Middle incomeMoldovaMongoliaMontenegroMoroccoMozambiqueMyanmarNamibiaNepalNetherlandsNew ZealandNicaraguaNigerNigeriaNorth AmericaNorwayOECD membersOmanOther small statesPacific island small statesPakistanPanamaPapua New GuineaParaguayPeruPhilippinesPolandPortugalPost-demographic dividendPre-demographic dividendQatarRomaniaRussian FederationRwandaSamoaSao Tome and PrincipeSaudi ArabiaSenegalSerbiaSeychellesSierra LeoneSingaporeSlovak RepublicSloveniaSmall statesSolomon IslandsSouth AfricaSouth AsiaSouth Asia (IDA & IBRD)South SudanSpainSri LankaSt. Kitts and NevisSt. LuciaSt. Vincent and the GrenadinesSub-Saharan Africa Sub-Saharan Africa (excluding high income)Sub-Saharan Africa (IDA & IBRD countries)SudanSurinameSwazilandSwedenSwitzerlandSyrian Arab RepublicTajikistanTanzaniaThailandTimor-LesteTogoTongaTrinidad and TobagoTunisiaTurkeyUgandaUkraineUnited Arab EmiratesUnited KingdomUnited StatesUpper middle incomeUruguayVanuatuVenezuela, RBVietnamWest Bank and GazaWorldYemen, Rep.ZambiaZimbabwe Timeline:
This timeline shows a graph from 1961 to 2016 of Guyana. No data until 1960. Number of actual observations by date: 56.
Source name:
World Development Indicators
Source organization:
International Monetary Fund, International Financial Statistics and data files, and World Bank and OECD GDP estimates.
Categories, topics:
Financial Sector
Last updated:
apr 23, 2017
Indicators value changes by year
Maximum:
53.987
jan 1, 2002
At the date of observation
Value
Absolute change
Change from previous value
jan 1, 1961
11.241
+11.241
0.0%
jan 1, 1962
9.228
-2.013
-17.91%
jan 1, 1963
8.618
-0.61
-6.61%
jan 1, 1964
9.525
+0.908
10.53%
jan 1, 1965
9.524
-0.002
-0.02%
jan 1, 1966
8.552
-0.972
-10.21%
jan 1, 1967
10.545
+1.994
23.31%
jan 1, 1968
11.126
+0.581
5.51%
jan 1, 1969
13.412
+2.286
20.55%
jan 1, 1970
14.858
+1.445
10.78%
jan 1, 1971
16.436
+1.578
10.62%
jan 1, 1972
16.68
+0.244
1.48%
jan 1, 1973
16.178
-0.501
-3.01%
jan 1, 1974
17.998
+1.82
11.25%
jan 1, 1975
13.047
-4.951
-27.51%
jan 1, 1976
11.743
-1.304
-10.0%
jan 1, 1977
12.973
+1.23
10.47%
jan 1, 1978
13.224
+0.251
1.93%
jan 1, 1979
13.088
-0.135
-1.02%
jan 1, 1980
16.109
+3.02
23.08%
jan 1, 1981
16.682
+0.573
3.56%
jan 1, 1982
20.115
+3.434
20.58%
jan 1, 1983
25.818
+5.703
28.35%
jan 1, 1984
29.775
+3.957
15.33%
jan 1, 1985
31.562
+1.787
6.0%
jan 1, 1986
29.947
-1.615
-5.12%
jan 1, 1987
33.911
+3.964
13.24%
jan 1, 1988
30.264
-3.647
-10.76%
jan 1, 1989
40.416
+10.152
33.55%
jan 1, 1990
25.677
-14.739
-36.47%
jan 1, 1991
27.169
+1.492
5.81%
jan 1, 1992
18.033
-9.135
-33.62%
jan 1, 1993
19.472
+1.439
7.98%
jan 1, 1994
19.101
-0.372
-1.91%
jan 1, 1995
20.05
+0.949
4.97%
jan 1, 1996
26.022
+5.972
29.79%
jan 1, 1997
39.346
+13.323
51.2%
jan 1, 1998
45.434
+6.088
15.47%
jan 1, 1999
52.554
+7.121
15.67%
jan 1, 2000
50.066
-2.489
-4.74%
jan 1, 2001
50.474
+0.409
0.82%
jan 1, 2002
53.987
+3.513
6.96%
jan 1, 2003
53.4
-0.587
-1.09%
jan 1, 2004
44.955
-8.445
-15.81%
jan 1, 2005
41.14
-3.815
-8.49%
jan 1, 2006
41.726
+0.586
1.42%
jan 1, 2007
27.135
-14.591
-34.97%
jan 1, 2008
26.171
-0.964
-3.55%
jan 1, 2009
27.829
+1.657
6.33%
jan 1, 2010
28.439
+0.61
2.19%
jan 1, 2011
29.665
+1.226
4.31%
jan 1, 2012
30.774
+1.109
3.74%
jan 1, 2013
33.275
+2.502
8.13%
jan 1, 2014
36.299
+3.024
9.09%
jan 1, 2015
38.497
+2.198
6.05%
jan 1, 2016
32.765
-5.732
-14.89%
Ranking of countries by current statistics by years


Comments: