29
/
en
AIzaSyAYiBZKx7MnpbEhh9jyipgxe19OcubqV5w
April 1, 2024
29759
Euro area
EMU
false
2
1
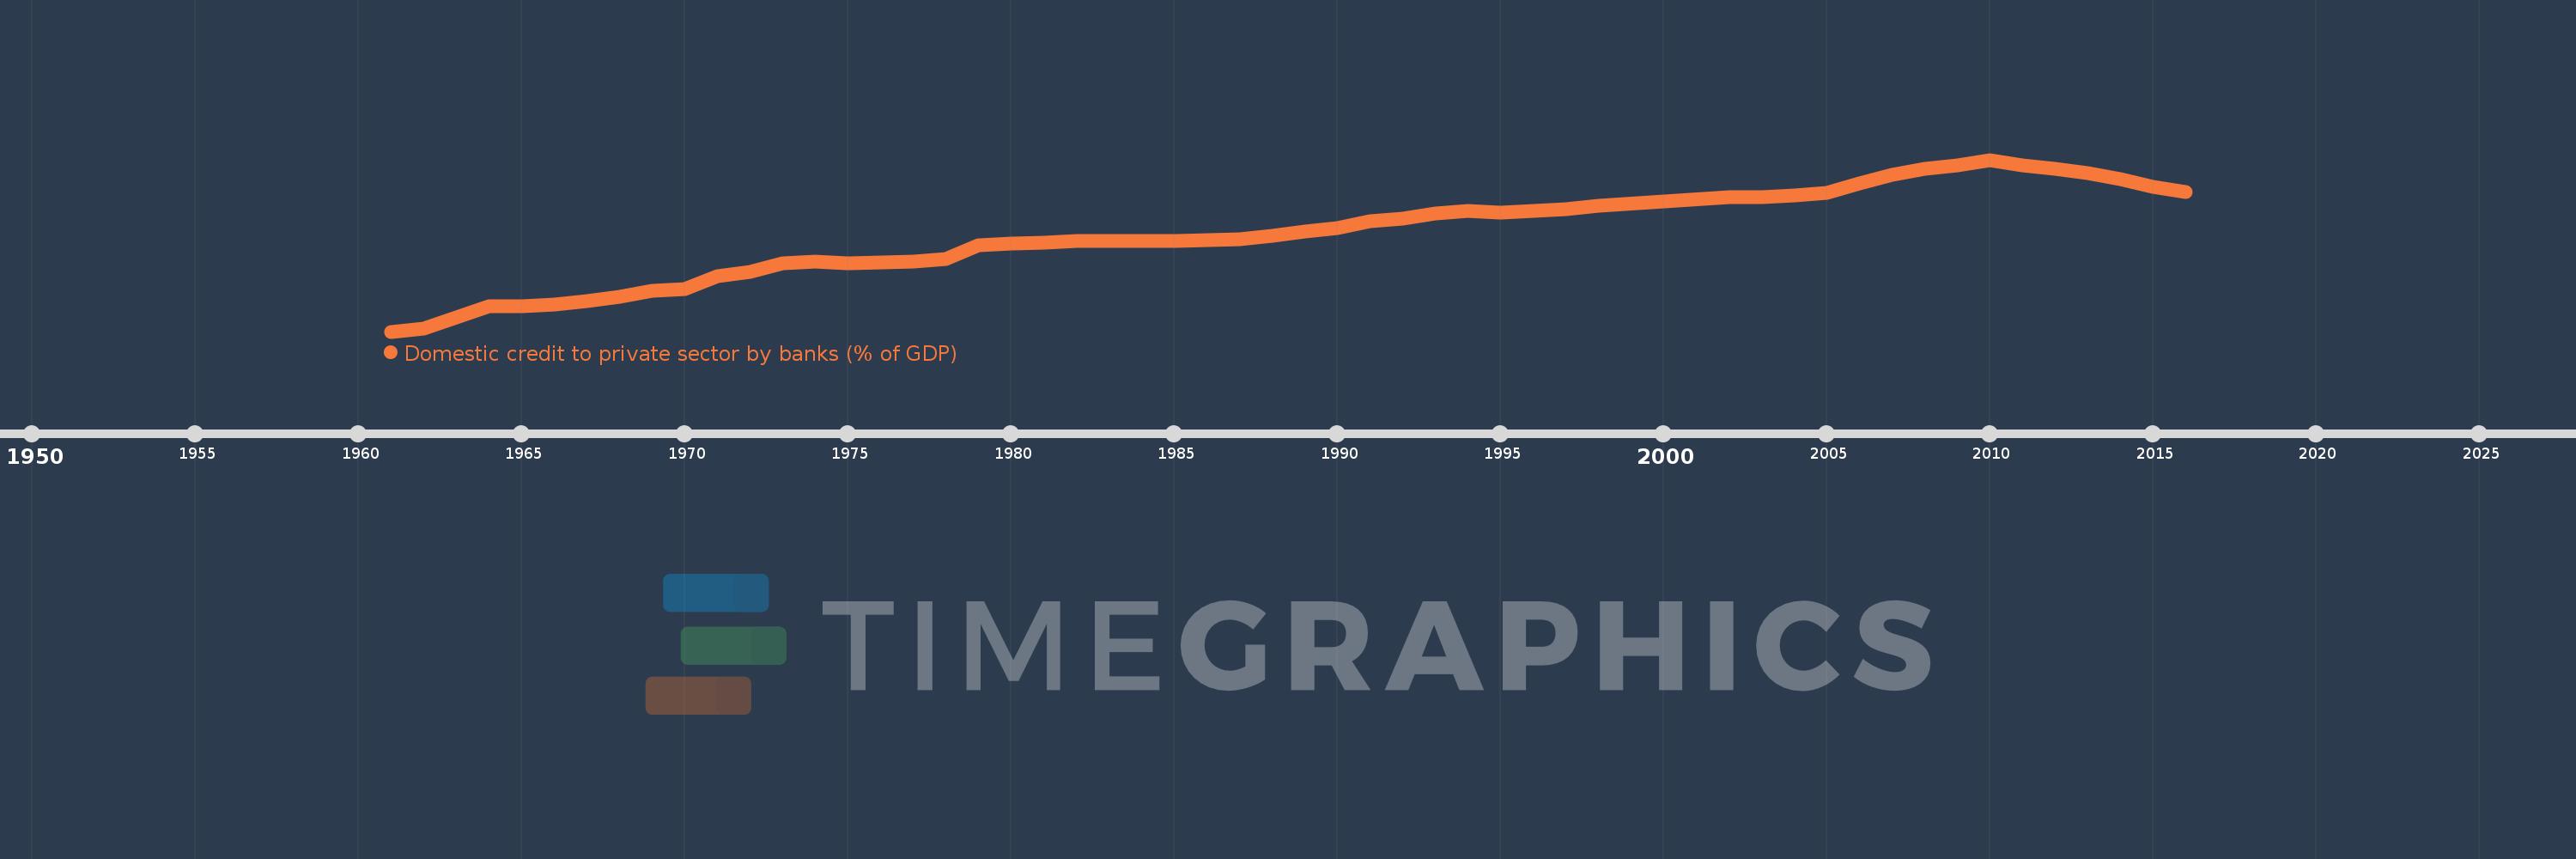
Domestic credit to private sector by banks (% of GDP)
2016,2015,2014,2013,2012,2011,2010,2009,2008,2007,2006,2005,2004,2003,2002,1998,1997,1996,1995,1994,1993,1992,1991,1990,1989,1988,1987,1986,1985,1984,1983,1982,1981,1980,1979,1978,1977,1976,1975,1974,1973,1972,1971,1970,1969,1968,1967,1966,1965,1964,1962,1961
This statistics in other country:
AfghanistanAlbaniaAlgeriaAngolaAntigua and BarbudaArab WorldArgentinaArmeniaArubaAustraliaAustriaAzerbaijanBahamas, TheBahrainBangladeshBarbadosBelarusBelgiumBelizeBeninBhutanBoliviaBosnia and HerzegovinaBotswanaBrazilBrunei DarussalamBulgariaBurkina FasoBurundiCabo VerdeCambodiaCameroonCanadaCaribbean small statesCentral African RepublicCentral Europe and the BalticsChadChileChinaColombiaComorosCongo, Dem. Rep.Congo, Rep.Costa RicaCote d'IvoireCroatiaCyprusCzech RepublicDenmarkDjiboutiDominicaDominican RepublicEarly-demographic dividendEast Asia & PacificEast Asia & Pacific (excluding high income)East Asia & Pacific (IDA & IBRD countries)EcuadorEgypt, Arab Rep.El SalvadorEquatorial GuineaEritreaEstoniaEthiopiaEuro areaEurope & Central AsiaEurope & Central Asia (excluding high income)Europe & Central Asia (IDA & IBRD countries)European UnionFijiFinlandFragile and conflict affected situationsFranceGabonGambia, TheGeorgiaGermanyGhanaGreeceGrenadaGuatemalaGuineaGuinea-BissauGuyanaHaitiHeavily indebted poor countries (HIPC)High incomeHondurasHong Kong SAR, ChinaHungaryIBRD onlyIcelandIDA & IBRD totalIDA blendIDA onlyIDA totalIndiaIndonesiaIran, Islamic Rep.IraqIrelandIsraelItalyJamaicaJapanJordanKazakhstanKenyaKorea, Rep.KosovoKuwaitKyrgyz RepublicLao PDRLate-demographic dividendLatin America & Caribbean Latin America & Caribbean (excluding high income)Latin America & the Caribbean (IDA & IBRD countries)LatviaLeast developed countries: UN classificationLebanonLesothoLiberiaLibyaLithuaniaLow & middle incomeLow incomeLower middle incomeLuxembourgMacao SAR, ChinaMacedonia, FYRMadagascarMalawiMalaysiaMaldivesMaliMaltaMauritaniaMauritiusMexicoMicronesia, Fed. Sts.Middle East & North AfricaMiddle East & North Africa (excluding high income)Middle East & North Africa (IDA & IBRD countries)Middle incomeMoldovaMongoliaMontenegroMoroccoMozambiqueMyanmarNamibiaNepalNetherlandsNew ZealandNicaraguaNigerNigeriaNorth AmericaNorwayOECD membersOmanOther small statesPacific island small statesPakistanPanamaPapua New GuineaParaguayPeruPhilippinesPolandPortugalPost-demographic dividendPre-demographic dividendQatarRomaniaRussian FederationRwandaSamoaSao Tome and PrincipeSaudi ArabiaSenegalSerbiaSeychellesSierra LeoneSingaporeSlovak RepublicSloveniaSmall statesSolomon IslandsSouth AfricaSouth AsiaSouth Asia (IDA & IBRD)South SudanSpainSri LankaSt. Kitts and NevisSt. LuciaSt. Vincent and the GrenadinesSub-Saharan Africa Sub-Saharan Africa (excluding high income)Sub-Saharan Africa (IDA & IBRD countries)SudanSurinameSwazilandSwedenSwitzerlandSyrian Arab RepublicTajikistanTanzaniaThailandTimor-LesteTogoTongaTrinidad and TobagoTunisiaTurkeyUgandaUkraineUnited Arab EmiratesUnited KingdomUnited StatesUpper middle incomeUruguayVanuatuVenezuela, RBVietnamWest Bank and GazaWorldYemen, Rep.ZambiaZimbabwe Timeline:
This timeline shows a graph from 1961 to 2016 of Euro area. No data until 1960. Number of actual observations by date: 52.
Source name:
World Development Indicators
Source organization:
International Monetary Fund, International Financial Statistics and data files, and World Bank and OECD GDP estimates.
Categories, topics:
Financial Sector
Last updated:
apr 23, 2017
Indicators value changes by year
Minimum:
20.593
jan 1, 1961
Maximum:
106.092
jan 1, 2010
At the date of observation
Value
Absolute change
Change from previous value
jan 1, 1961
20.593
+20.593
0.0%
jan 1, 1962
22.173
+1.58
7.67%
jan 1, 1964
33.03
+10.857
48.97%
jan 1, 1965
33.016
-0.015
-0.04%
jan 1, 1966
33.913
+0.897
2.72%
jan 1, 1967
35.73
+1.818
5.36%
jan 1, 1968
38.075
+2.345
6.56%
jan 1, 1969
40.712
+2.637
6.93%
jan 1, 1970
41.775
+1.063
2.61%
jan 1, 1971
48.184
+6.41
15.34%
jan 1, 1972
50.407
+2.223
4.61%
jan 1, 1973
54.786
+4.379
8.69%
jan 1, 1974
55.458
+0.672
1.23%
jan 1, 1975
54.451
-1.008
-1.82%
jan 1, 1976
55.039
+0.588
1.08%
jan 1, 1977
55.582
+0.543
0.99%
jan 1, 1978
56.925
+1.343
2.42%
jan 1, 1979
63.659
+6.734
11.83%
jan 1, 1980
64.512
+0.853
1.34%
jan 1, 1981
64.86
+0.348
0.54%
jan 1, 1982
65.513
+0.653
1.01%
jan 1, 1983
65.61
+0.098
0.15%
jan 1, 1984
65.53
-0.081
-0.12%
jan 1, 1985
65.681
+0.151
0.23%
jan 1, 1986
66.071
+0.39
0.59%
jan 1, 1987
66.499
+0.427
0.65%
jan 1, 1988
68.338
+1.839
2.77%
jan 1, 1989
70.562
+2.225
3.26%
jan 1, 1990
71.941
+1.378
1.95%
jan 1, 1991
75.393
+3.452
4.8%
jan 1, 1992
76.833
+1.44
1.91%
jan 1, 1993
79.355
+2.523
3.28%
jan 1, 1994
80.781
+1.425
1.8%
jan 1, 1995
79.976
-0.804
-1.0%
jan 1, 1996
80.51
+0.534
0.67%
jan 1, 1997
81.351
+0.841
1.04%
jan 1, 1998
83.111
+1.76
2.16%
jan 1, 2002
87.469
+4.359
5.24%
jan 1, 2003
87.55
+0.081
0.09%
jan 1, 2004
88.44
+0.89
1.02%
jan 1, 2005
89.583
+1.143
1.29%
jan 1, 2006
94.359
+4.776
5.33%
jan 1, 2007
98.481
+4.122
4.37%
jan 1, 2008
101.429
+2.949
2.99%
jan 1, 2009
103.304
+1.874
1.85%
jan 1, 2010
106.092
+2.788
2.7%
jan 1, 2011
103.353
-2.739
-2.58%
jan 1, 2012
101.612
-1.742
-1.69%
jan 1, 2013
99.638
-1.973
-1.94%
jan 1, 2014
96.614
-3.024
-3.04%
jan 1, 2015
92.749
-3.866
-4.0%
jan 1, 2016
90.241
-2.507
-2.7%
Ranking of countries by current statistics by years


Comments: