29
/
en
AIzaSyAYiBZKx7MnpbEhh9jyipgxe19OcubqV5w
April 1, 2024
54019
Pacific island small states
PSS
false
2
1
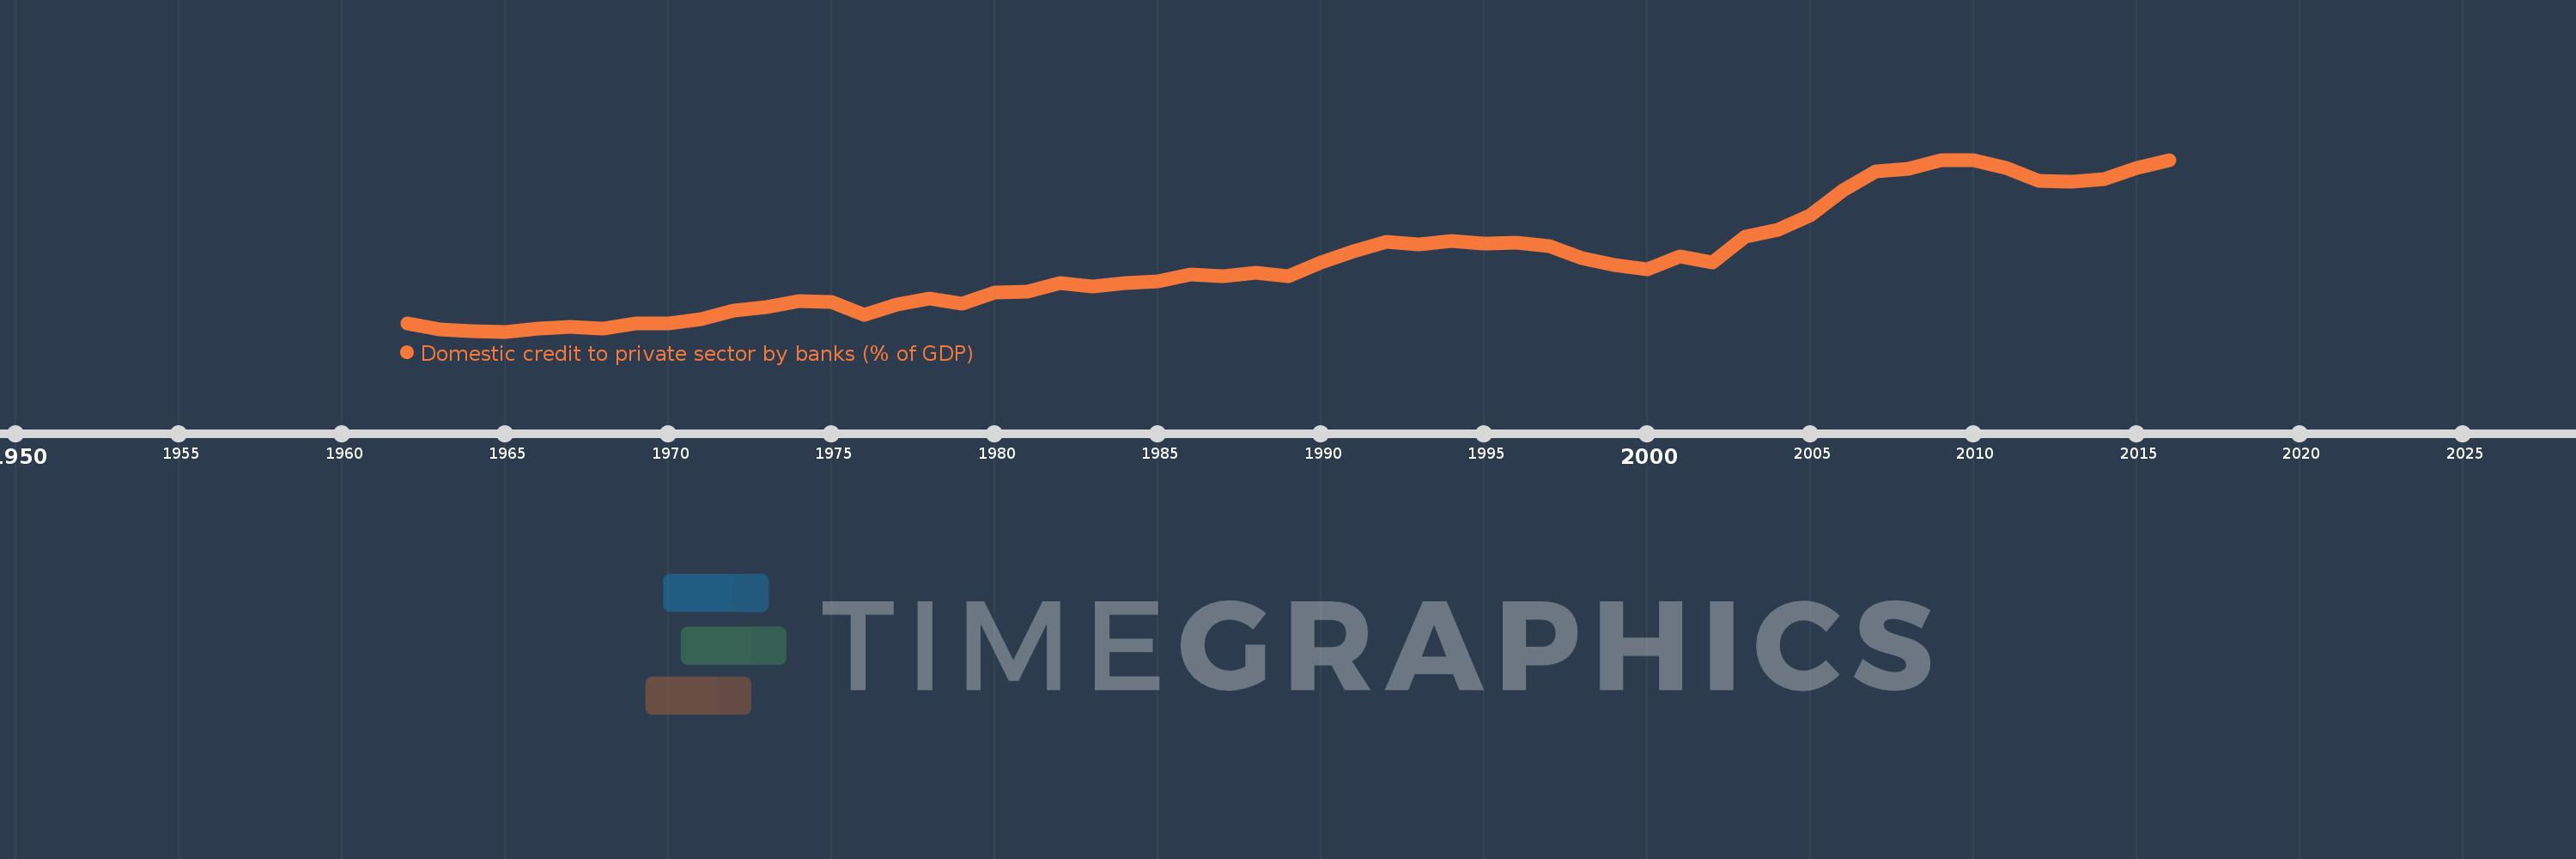
Domestic credit to private sector by banks (% of GDP)
2016,2015,2014,2013,2012,2011,2010,2009,2008,2007,2006,2005,2004,2003,2002,2001,2000,1999,1998,1997,1996,1995,1994,1993,1992,1991,1990,1989,1988,1987,1986,1985,1984,1983,1982,1981,1980,1979,1978,1977,1976,1975,1974,1973,1972,1971,1970,1969,1968,1967,1966,1965,1964,1963,1962
This statistics in other country:
AfghanistanAlbaniaAlgeriaAngolaAntigua and BarbudaArab WorldArgentinaArmeniaArubaAustraliaAustriaAzerbaijanBahamas, TheBahrainBangladeshBarbadosBelarusBelgiumBelizeBeninBhutanBoliviaBosnia and HerzegovinaBotswanaBrazilBrunei DarussalamBulgariaBurkina FasoBurundiCabo VerdeCambodiaCameroonCanadaCaribbean small statesCentral African RepublicCentral Europe and the BalticsChadChileChinaColombiaComorosCongo, Dem. Rep.Congo, Rep.Costa RicaCote d'IvoireCroatiaCyprusCzech RepublicDenmarkDjiboutiDominicaDominican RepublicEarly-demographic dividendEast Asia & PacificEast Asia & Pacific (excluding high income)East Asia & Pacific (IDA & IBRD countries)EcuadorEgypt, Arab Rep.El SalvadorEquatorial GuineaEritreaEstoniaEthiopiaEuro areaEurope & Central AsiaEurope & Central Asia (excluding high income)Europe & Central Asia (IDA & IBRD countries)European UnionFijiFinlandFragile and conflict affected situationsFranceGabonGambia, TheGeorgiaGermanyGhanaGreeceGrenadaGuatemalaGuineaGuinea-BissauGuyanaHaitiHeavily indebted poor countries (HIPC)High incomeHondurasHong Kong SAR, ChinaHungaryIBRD onlyIcelandIDA & IBRD totalIDA blendIDA onlyIDA totalIndiaIndonesiaIran, Islamic Rep.IraqIrelandIsraelItalyJamaicaJapanJordanKazakhstanKenyaKorea, Rep.KosovoKuwaitKyrgyz RepublicLao PDRLate-demographic dividendLatin America & Caribbean Latin America & Caribbean (excluding high income)Latin America & the Caribbean (IDA & IBRD countries)LatviaLeast developed countries: UN classificationLebanonLesothoLiberiaLibyaLithuaniaLow & middle incomeLow incomeLower middle incomeLuxembourgMacao SAR, ChinaMacedonia, FYRMadagascarMalawiMalaysiaMaldivesMaliMaltaMauritaniaMauritiusMexicoMicronesia, Fed. Sts.Middle East & North AfricaMiddle East & North Africa (excluding high income)Middle East & North Africa (IDA & IBRD countries)Middle incomeMoldovaMongoliaMontenegroMoroccoMozambiqueMyanmarNamibiaNepalNetherlandsNew ZealandNicaraguaNigerNigeriaNorth AmericaNorwayOECD membersOmanOther small statesPacific island small statesPakistanPanamaPapua New GuineaParaguayPeruPhilippinesPolandPortugalPost-demographic dividendPre-demographic dividendQatarRomaniaRussian FederationRwandaSamoaSao Tome and PrincipeSaudi ArabiaSenegalSerbiaSeychellesSierra LeoneSingaporeSlovak RepublicSloveniaSmall statesSolomon IslandsSouth AfricaSouth AsiaSouth Asia (IDA & IBRD)South SudanSpainSri LankaSt. Kitts and NevisSt. LuciaSt. Vincent and the GrenadinesSub-Saharan Africa Sub-Saharan Africa (excluding high income)Sub-Saharan Africa (IDA & IBRD countries)SudanSurinameSwazilandSwedenSwitzerlandSyrian Arab RepublicTajikistanTanzaniaThailandTimor-LesteTogoTongaTrinidad and TobagoTunisiaTurkeyUgandaUkraineUnited Arab EmiratesUnited KingdomUnited StatesUpper middle incomeUruguayVanuatuVenezuela, RBVietnamWest Bank and GazaWorldYemen, Rep.ZambiaZimbabwe Timeline:
This timeline shows a graph from 1962 to 2016 of Pacific island small states. No data until 1961. Number of actual observations by date: 55.
Source name:
World Development Indicators
Source organization:
International Monetary Fund, International Financial Statistics and data files, and World Bank and OECD GDP estimates.
Categories, topics:
Financial Sector
Last updated:
apr 23, 2017
Indicators value changes by year
Maximum:
54.111
jan 1, 2016
At the date of observation
Value
Absolute change
Change from previous value
jan 1, 1962
11.259
+11.259
0.0%
jan 1, 1963
9.681
-1.578
-14.02%
jan 1, 1964
9.133
-0.548
-5.66%
jan 1, 1965
9.049
-0.084
-0.92%
jan 1, 1966
9.901
+0.851
9.41%
jan 1, 1967
10.246
+0.346
3.49%
jan 1, 1968
9.791
-0.456
-4.45%
jan 1, 1969
11.237
+1.447
14.78%
jan 1, 1970
11.2
-0.037
-0.33%
jan 1, 1971
12.384
+1.184
10.57%
jan 1, 1972
14.527
+2.143
17.3%
jan 1, 1973
15.461
+0.934
6.43%
jan 1, 1974
17.045
+1.584
10.25%
jan 1, 1975
16.787
-0.258
-1.52%
jan 1, 1976
13.399
-3.387
-20.18%
jan 1, 1977
16.076
+2.677
19.98%
jan 1, 1978
17.755
+1.679
10.44%
jan 1, 1979
16.405
-1.351
-7.61%
jan 1, 1980
19.348
+2.944
17.95%
jan 1, 1981
19.418
+0.069
0.36%
jan 1, 1982
21.756
+2.338
12.04%
jan 1, 1983
20.805
-0.951
-4.37%
jan 1, 1984
21.854
+1.049
5.04%
jan 1, 1985
22.304
+0.45
2.06%
jan 1, 1986
24.012
+1.708
7.66%
jan 1, 1987
23.492
-0.521
-2.17%
jan 1, 1988
24.424
+0.932
3.97%
jan 1, 1989
23.601
-0.823
-3.37%
jan 1, 1990
27.156
+3.555
15.06%
jan 1, 1991
30.188
+3.032
11.16%
jan 1, 1992
32.647
+2.459
8.15%
jan 1, 1993
31.846
-0.801
-2.45%
jan 1, 1994
32.712
+0.867
2.72%
jan 1, 1995
32.185
-0.528
-1.61%
jan 1, 1996
32.314
+0.13
0.4%
jan 1, 1997
31.505
-0.81
-2.51%
jan 1, 1998
28.379
-3.125
-9.92%
jan 1, 1999
26.541
-1.838
-6.48%
jan 1, 2000
25.352
-1.189
-4.48%
jan 1, 2001
28.793
+3.441
13.57%
jan 1, 2002
27.118
-1.675
-5.82%
jan 1, 2003
33.961
+6.844
25.24%
jan 1, 2004
35.78
+1.819
5.36%
jan 1, 2005
39.67
+3.889
10.87%
jan 1, 2006
46.132
+6.463
16.29%
jan 1, 2007
51.136
+5.004
10.85%
jan 1, 2008
51.75
+0.614
1.2%
jan 1, 2009
54.055
+2.305
4.45%
jan 1, 2010
53.936
-0.119
-0.22%
jan 1, 2011
52.013
-1.923
-3.57%
jan 1, 2012
48.623
-3.39
-6.52%
jan 1, 2013
48.333
-0.291
-0.6%
jan 1, 2014
48.999
+0.667
1.38%
jan 1, 2015
51.931
+2.931
5.98%
jan 1, 2016
54.111
+2.18
4.2%
Ranking of countries by current statistics by years


Comments: