29
/
en
AIzaSyAYiBZKx7MnpbEhh9jyipgxe19OcubqV5w
April 1, 2024
235611
Senegal
SEN
true
2
1
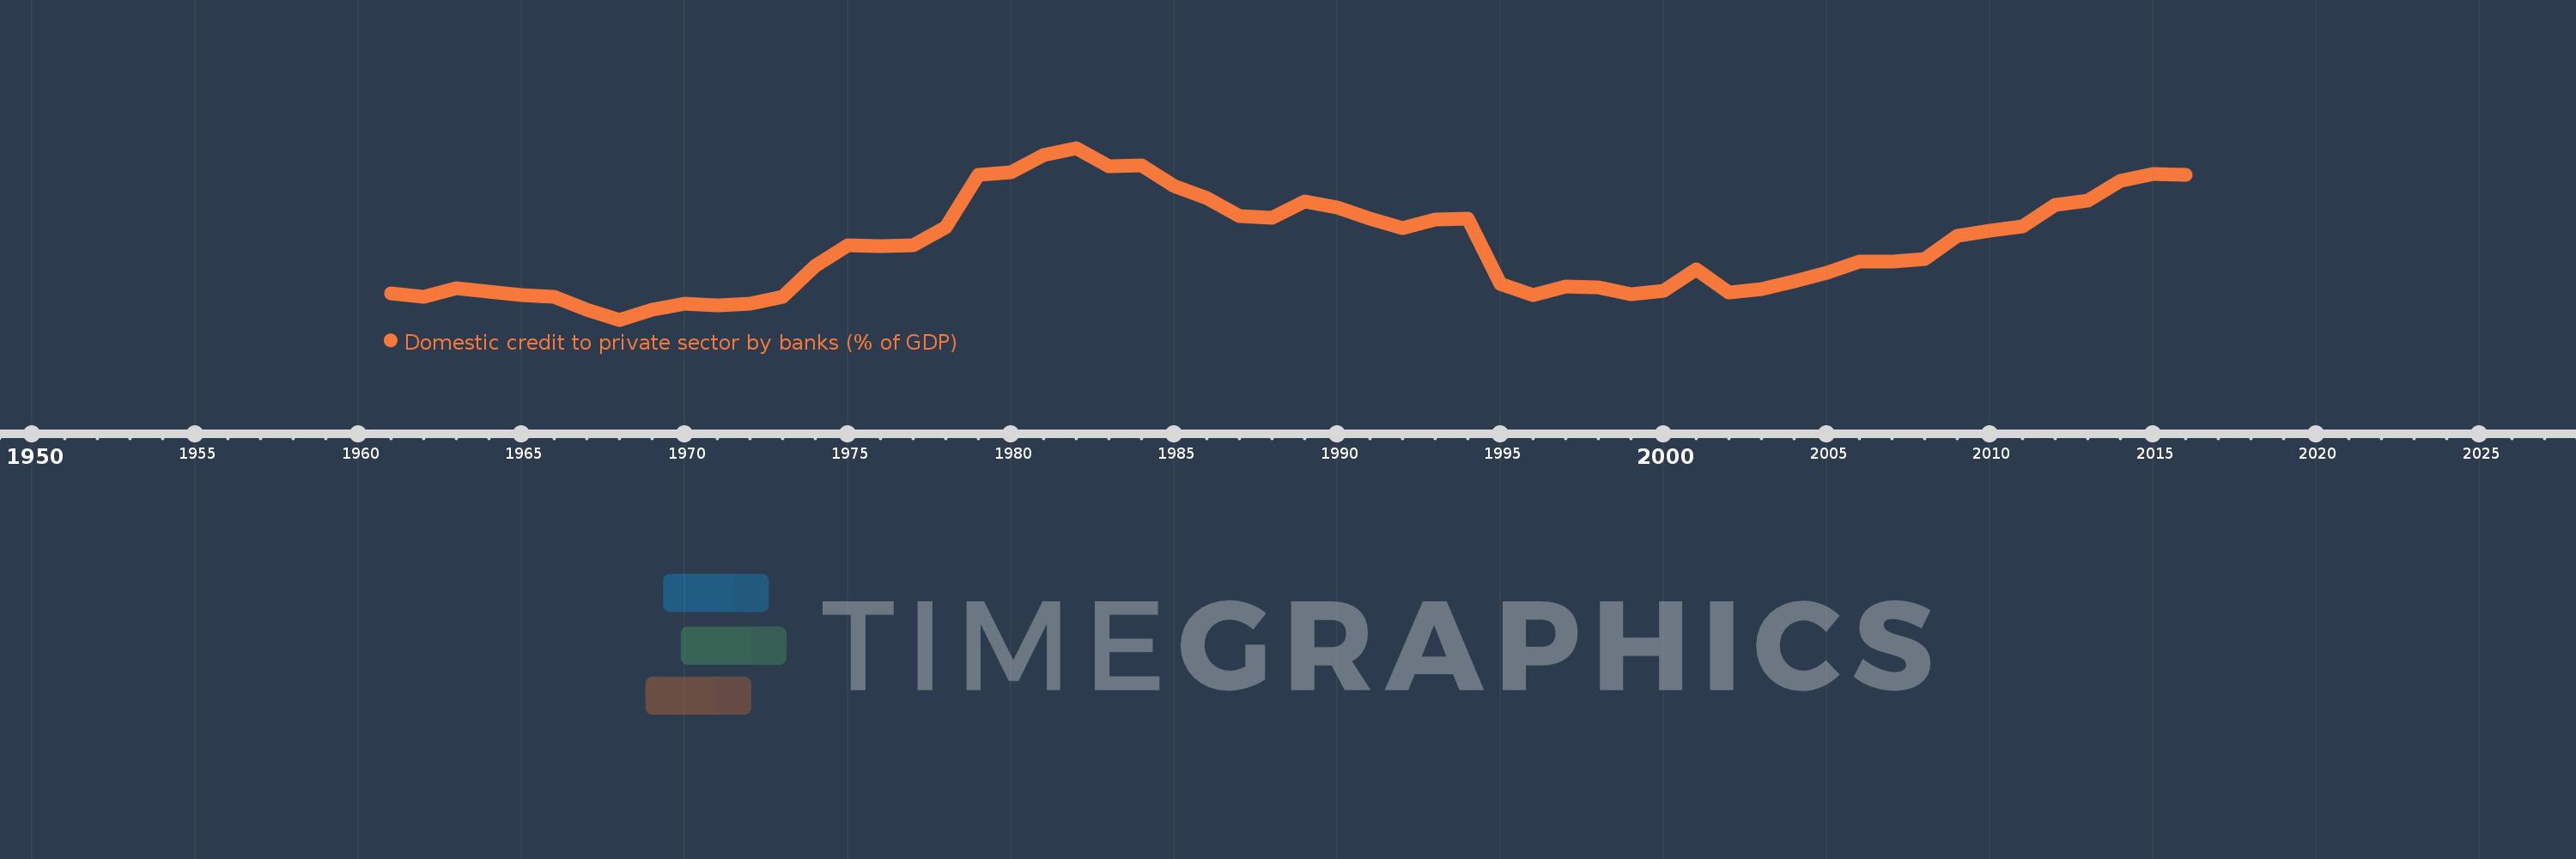
Domestic credit to private sector by banks (% of GDP)
2016,2015,2014,2013,2012,2011,2010,2009,2008,2007,2006,2005,2004,2003,2002,2001,2000,1999,1998,1997,1996,1995,1994,1993,1992,1991,1990,1989,1988,1987,1986,1985,1984,1983,1982,1981,1980,1979,1978,1977,1976,1975,1974,1973,1972,1971,1970,1969,1968,1967,1966,1965,1964,1963,1962,1961
This statistics in other country:
AfghanistanAlbaniaAlgeriaAngolaAntigua and BarbudaArab WorldArgentinaArmeniaArubaAustraliaAustriaAzerbaijanBahamas, TheBahrainBangladeshBarbadosBelarusBelgiumBelizeBeninBhutanBoliviaBosnia and HerzegovinaBotswanaBrazilBrunei DarussalamBulgariaBurkina FasoBurundiCabo VerdeCambodiaCameroonCanadaCaribbean small statesCentral African RepublicCentral Europe and the BalticsChadChileChinaColombiaComorosCongo, Dem. Rep.Congo, Rep.Costa RicaCote d'IvoireCroatiaCyprusCzech RepublicDenmarkDjiboutiDominicaDominican RepublicEarly-demographic dividendEast Asia & PacificEast Asia & Pacific (excluding high income)East Asia & Pacific (IDA & IBRD countries)EcuadorEgypt, Arab Rep.El SalvadorEquatorial GuineaEritreaEstoniaEthiopiaEuro areaEurope & Central AsiaEurope & Central Asia (excluding high income)Europe & Central Asia (IDA & IBRD countries)European UnionFijiFinlandFragile and conflict affected situationsFranceGabonGambia, TheGeorgiaGermanyGhanaGreeceGrenadaGuatemalaGuineaGuinea-BissauGuyanaHaitiHeavily indebted poor countries (HIPC)High incomeHondurasHong Kong SAR, ChinaHungaryIBRD onlyIcelandIDA & IBRD totalIDA blendIDA onlyIDA totalIndiaIndonesiaIran, Islamic Rep.IraqIrelandIsraelItalyJamaicaJapanJordanKazakhstanKenyaKorea, Rep.KosovoKuwaitKyrgyz RepublicLao PDRLate-demographic dividendLatin America & Caribbean Latin America & Caribbean (excluding high income)Latin America & the Caribbean (IDA & IBRD countries)LatviaLeast developed countries: UN classificationLebanonLesothoLiberiaLibyaLithuaniaLow & middle incomeLow incomeLower middle incomeLuxembourgMacao SAR, ChinaMacedonia, FYRMadagascarMalawiMalaysiaMaldivesMaliMaltaMauritaniaMauritiusMexicoMicronesia, Fed. Sts.Middle East & North AfricaMiddle East & North Africa (excluding high income)Middle East & North Africa (IDA & IBRD countries)Middle incomeMoldovaMongoliaMontenegroMoroccoMozambiqueMyanmarNamibiaNepalNetherlandsNew ZealandNicaraguaNigerNigeriaNorth AmericaNorwayOECD membersOmanOther small statesPacific island small statesPakistanPanamaPapua New GuineaParaguayPeruPhilippinesPolandPortugalPost-demographic dividendPre-demographic dividendQatarRomaniaRussian FederationRwandaSamoaSao Tome and PrincipeSaudi ArabiaSenegalSerbiaSeychellesSierra LeoneSingaporeSlovak RepublicSloveniaSmall statesSolomon IslandsSouth AfricaSouth AsiaSouth Asia (IDA & IBRD)South SudanSpainSri LankaSt. Kitts and NevisSt. LuciaSt. Vincent and the GrenadinesSub-Saharan Africa Sub-Saharan Africa (excluding high income)Sub-Saharan Africa (IDA & IBRD countries)SudanSurinameSwazilandSwedenSwitzerlandSyrian Arab RepublicTajikistanTanzaniaThailandTimor-LesteTogoTongaTrinidad and TobagoTunisiaTurkeyUgandaUkraineUnited Arab EmiratesUnited KingdomUnited StatesUpper middle incomeUruguayVanuatuVenezuela, RBVietnamWest Bank and GazaWorldYemen, Rep.ZambiaZimbabwe Timeline:
This timeline shows a graph from 1961 to 2016 of Senegal. No data until 1960. Number of actual observations by date: 56.
Source name:
World Development Indicators
Source organization:
International Monetary Fund, International Financial Statistics and data files, and World Bank and OECD GDP estimates.
Categories, topics:
Financial Sector
Last updated:
apr 23, 2017
Indicators value changes by year
Minimum:
10.734
jan 1, 1968
Maximum:
37.393
jan 1, 1982
At the date of observation
Value
Absolute change
Change from previous value
jan 1, 1961
14.846
+14.846
0.0%
jan 1, 1962
14.262
-0.584
-3.93%
jan 1, 1963
15.608
+1.346
9.44%
jan 1, 1964
15.089
-0.519
-3.33%
jan 1, 1965
14.51
-0.579
-3.84%
jan 1, 1966
14.263
-0.247
-1.7%
jan 1, 1967
12.336
-1.928
-13.51%
jan 1, 1968
10.734
-1.601
-12.98%
jan 1, 1969
12.353
+1.619
15.08%
jan 1, 1970
13.246
+0.893
7.23%
jan 1, 1971
12.905
-0.341
-2.57%
jan 1, 1972
13.244
+0.34
2.63%
jan 1, 1973
14.245
+1.001
7.56%
jan 1, 1974
19.126
+4.881
34.26%
jan 1, 1975
22.258
+3.132
16.38%
jan 1, 1976
22.16
-0.097
-0.44%
jan 1, 1977
22.354
+0.194
0.87%
jan 1, 1978
25.135
+2.781
12.44%
jan 1, 1979
33.234
+8.1
32.22%
jan 1, 1980
33.596
+0.362
1.09%
jan 1, 1981
36.242
+2.645
7.87%
jan 1, 1982
37.393
+1.151
3.18%
jan 1, 1983
34.62
-2.773
-7.42%
jan 1, 1984
34.685
+0.066
0.19%
jan 1, 1985
31.48
-3.205
-9.24%
jan 1, 1986
29.647
-1.833
-5.82%
jan 1, 1987
26.856
-2.791
-9.41%
jan 1, 1988
26.5
-0.356
-1.32%
jan 1, 1989
29.054
+2.554
9.64%
jan 1, 1990
28.168
-0.886
-3.05%
jan 1, 1991
26.359
-1.809
-6.42%
jan 1, 1992
24.994
-1.365
-5.18%
jan 1, 1993
26.265
+1.27
5.08%
jan 1, 1994
26.387
+0.122
0.47%
jan 1, 1995
16.254
-10.133
-38.4%
jan 1, 1996
14.604
-1.65
-10.15%
jan 1, 1997
15.862
+1.258
8.61%
jan 1, 1998
15.705
-0.157
-0.99%
jan 1, 1999
14.728
-0.977
-6.22%
jan 1, 2000
15.251
+0.522
3.55%
jan 1, 2001
18.595
+3.345
21.93%
jan 1, 2002
14.98
-3.615
-19.44%
jan 1, 2003
15.552
+0.572
3.82%
jan 1, 2004
16.63
+1.078
6.93%
jan 1, 2005
18.026
+1.396
8.39%
jan 1, 2006
19.787
+1.761
9.77%
jan 1, 2007
19.728
-0.059
-0.3%
jan 1, 2008
20.134
+0.406
2.06%
jan 1, 2009
23.732
+3.598
17.87%
jan 1, 2010
24.514
+0.782
3.29%
jan 1, 2011
25.194
+0.68
2.77%
jan 1, 2012
28.612
+3.419
13.57%
jan 1, 2013
29.248
+0.636
2.22%
jan 1, 2014
32.254
+3.006
10.28%
jan 1, 2015
33.294
+1.039
3.22%
jan 1, 2016
33.23
-0.064
-0.19%
Ranking of countries by current statistics by years


Comments: