29
/
en
AIzaSyAYiBZKx7MnpbEhh9jyipgxe19OcubqV5w
April 1, 2024
123342
Ecuador
ECU
true
2
1
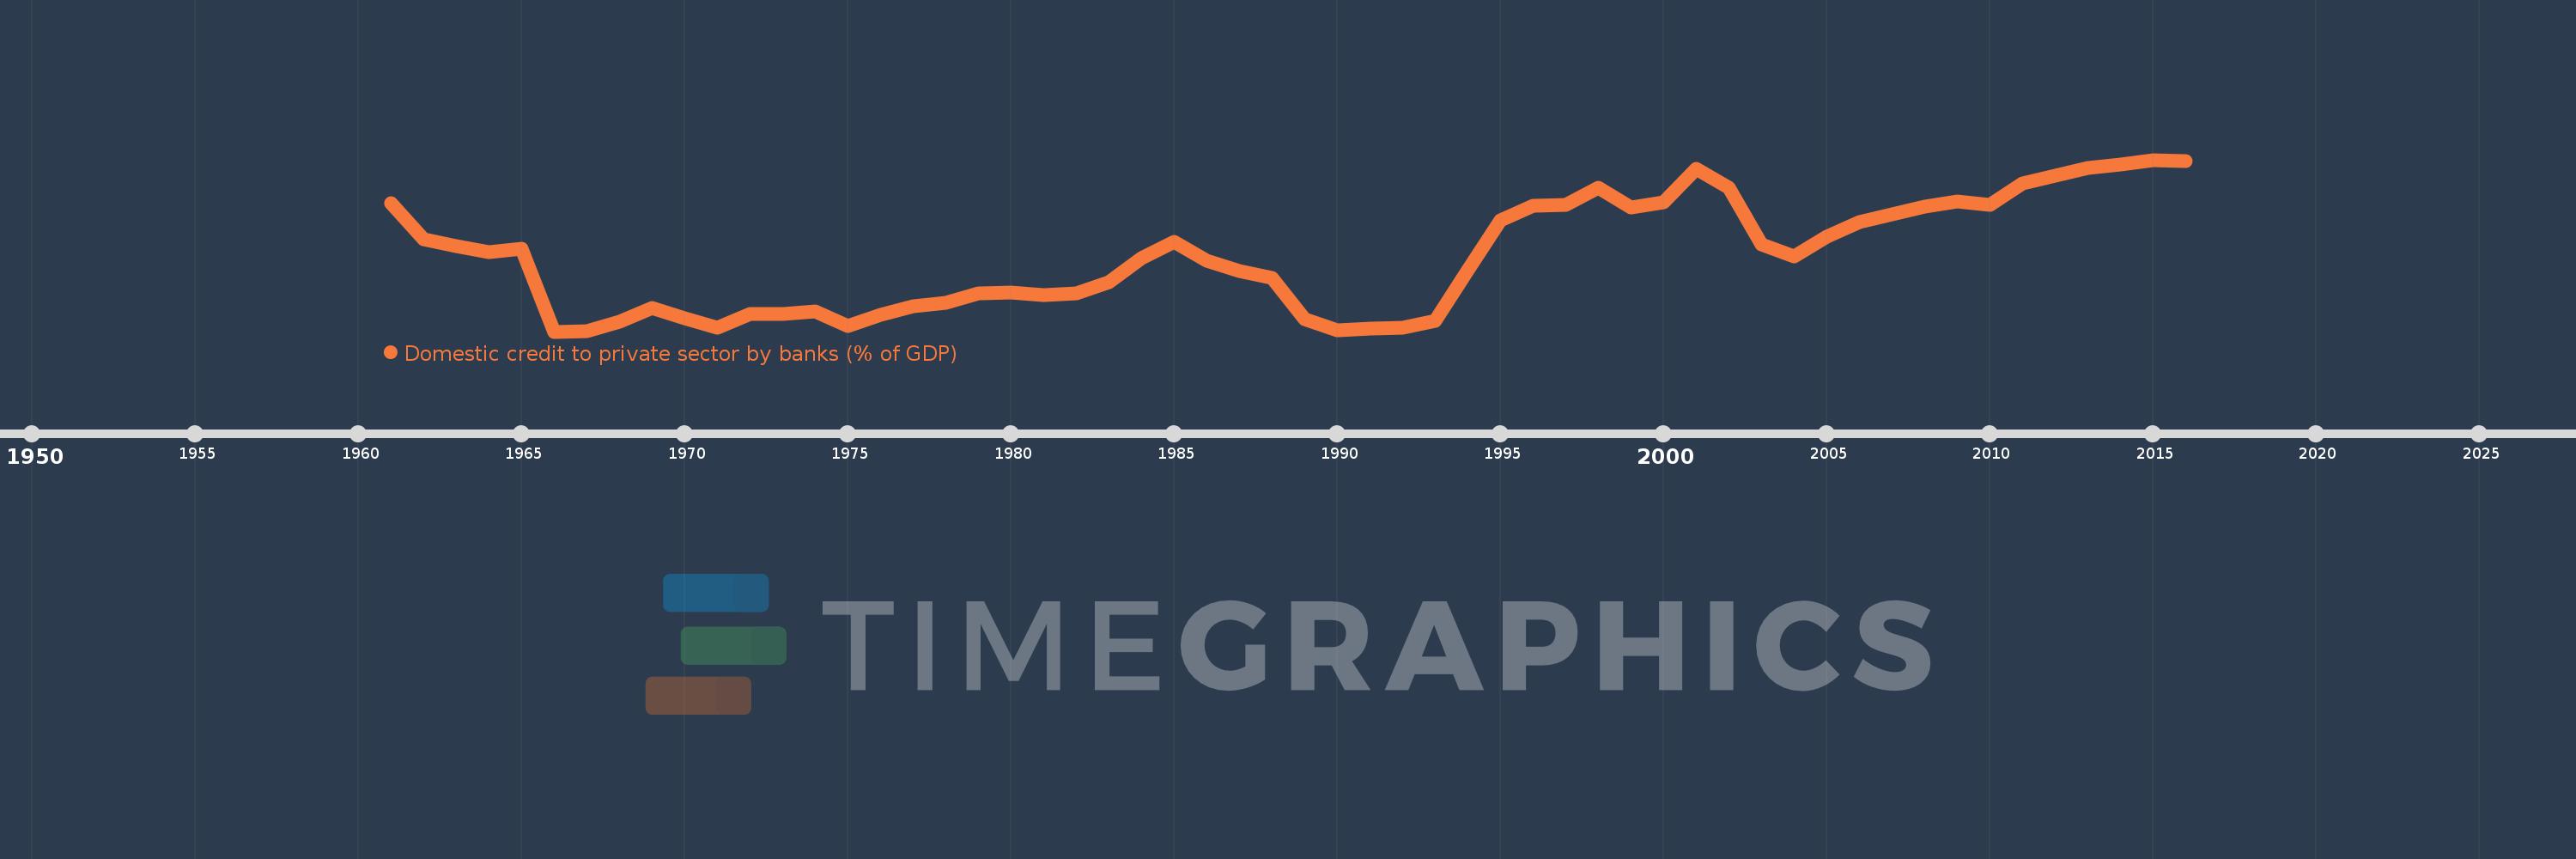
Domestic credit to private sector by banks (% of GDP)
2016,2015,2014,2013,2012,2011,2010,2009,2008,2007,2006,2005,2004,2003,2002,2001,2000,1999,1998,1997,1996,1995,1994,1993,1992,1991,1990,1989,1988,1987,1986,1985,1984,1983,1982,1981,1980,1979,1978,1977,1976,1975,1974,1973,1972,1971,1970,1969,1968,1967,1966,1965,1964,1963,1962,1961
This statistics in other country:
AfghanistanAlbaniaAlgeriaAngolaAntigua and BarbudaArab WorldArgentinaArmeniaArubaAustraliaAustriaAzerbaijanBahamas, TheBahrainBangladeshBarbadosBelarusBelgiumBelizeBeninBhutanBoliviaBosnia and HerzegovinaBotswanaBrazilBrunei DarussalamBulgariaBurkina FasoBurundiCabo VerdeCambodiaCameroonCanadaCaribbean small statesCentral African RepublicCentral Europe and the BalticsChadChileChinaColombiaComorosCongo, Dem. Rep.Congo, Rep.Costa RicaCote d'IvoireCroatiaCyprusCzech RepublicDenmarkDjiboutiDominicaDominican RepublicEarly-demographic dividendEast Asia & PacificEast Asia & Pacific (excluding high income)East Asia & Pacific (IDA & IBRD countries)EcuadorEgypt, Arab Rep.El SalvadorEquatorial GuineaEritreaEstoniaEthiopiaEuro areaEurope & Central AsiaEurope & Central Asia (excluding high income)Europe & Central Asia (IDA & IBRD countries)European UnionFijiFinlandFragile and conflict affected situationsFranceGabonGambia, TheGeorgiaGermanyGhanaGreeceGrenadaGuatemalaGuineaGuinea-BissauGuyanaHaitiHeavily indebted poor countries (HIPC)High incomeHondurasHong Kong SAR, ChinaHungaryIBRD onlyIcelandIDA & IBRD totalIDA blendIDA onlyIDA totalIndiaIndonesiaIran, Islamic Rep.IraqIrelandIsraelItalyJamaicaJapanJordanKazakhstanKenyaKorea, Rep.KosovoKuwaitKyrgyz RepublicLao PDRLate-demographic dividendLatin America & Caribbean Latin America & Caribbean (excluding high income)Latin America & the Caribbean (IDA & IBRD countries)LatviaLeast developed countries: UN classificationLebanonLesothoLiberiaLibyaLithuaniaLow & middle incomeLow incomeLower middle incomeLuxembourgMacao SAR, ChinaMacedonia, FYRMadagascarMalawiMalaysiaMaldivesMaliMaltaMauritaniaMauritiusMexicoMicronesia, Fed. Sts.Middle East & North AfricaMiddle East & North Africa (excluding high income)Middle East & North Africa (IDA & IBRD countries)Middle incomeMoldovaMongoliaMontenegroMoroccoMozambiqueMyanmarNamibiaNepalNetherlandsNew ZealandNicaraguaNigerNigeriaNorth AmericaNorwayOECD membersOmanOther small statesPacific island small statesPakistanPanamaPapua New GuineaParaguayPeruPhilippinesPolandPortugalPost-demographic dividendPre-demographic dividendQatarRomaniaRussian FederationRwandaSamoaSao Tome and PrincipeSaudi ArabiaSenegalSerbiaSeychellesSierra LeoneSingaporeSlovak RepublicSloveniaSmall statesSolomon IslandsSouth AfricaSouth AsiaSouth Asia (IDA & IBRD)South SudanSpainSri LankaSt. Kitts and NevisSt. LuciaSt. Vincent and the GrenadinesSub-Saharan Africa Sub-Saharan Africa (excluding high income)Sub-Saharan Africa (IDA & IBRD countries)SudanSurinameSwazilandSwedenSwitzerlandSyrian Arab RepublicTajikistanTanzaniaThailandTimor-LesteTogoTongaTrinidad and TobagoTunisiaTurkeyUgandaUkraineUnited Arab EmiratesUnited KingdomUnited StatesUpper middle incomeUruguayVanuatuVenezuela, RBVietnamWest Bank and GazaWorldYemen, Rep.ZambiaZimbabwe Timeline:
This timeline shows a graph from 1961 to 2016 of Ecuador. No data until 1960. Number of actual observations by date: 56.
Source name:
World Development Indicators
Source organization:
International Monetary Fund, International Financial Statistics and data files, and World Bank and OECD GDP estimates.
Categories, topics:
Financial Sector
Last updated:
apr 23, 2017
Indicators value changes by year
Maximum:
26.976
jan 1, 2015
At the date of observation
Value
Absolute change
Change from previous value
jan 1, 1961
22.316
+22.316
0.0%
jan 1, 1962
18.43
-3.886
-17.41%
jan 1, 1963
17.702
-0.728
-3.95%
jan 1, 1964
17.113
-0.589
-3.33%
jan 1, 1965
17.49
+0.377
2.2%
jan 1, 1966
8.578
-8.912
-50.95%
jan 1, 1967
8.619
+0.041
0.48%
jan 1, 1968
9.645
+1.026
11.9%
jan 1, 1969
11.131
+1.486
15.41%
jan 1, 1970
10.015
-1.116
-10.02%
jan 1, 1971
9.024
-0.991
-9.9%
jan 1, 1972
10.499
+1.475
16.35%
jan 1, 1973
10.421
-0.079
-0.75%
jan 1, 1974
10.736
+0.315
3.02%
jan 1, 1975
9.205
-1.53
-14.25%
jan 1, 1976
10.377
+1.171
12.72%
jan 1, 1977
11.298
+0.921
8.88%
jan 1, 1978
11.679
+0.381
3.37%
jan 1, 1979
12.706
+1.026
8.79%
jan 1, 1980
12.773
+0.067
0.53%
jan 1, 1981
12.444
-0.329
-2.58%
jan 1, 1982
12.696
+0.252
2.03%
jan 1, 1983
13.856
+1.16
9.13%
jan 1, 1984
16.461
+2.605
18.8%
jan 1, 1985
18.22
+1.759
10.69%
jan 1, 1986
16.199
-2.021
-11.09%
jan 1, 1987
15.026
-1.173
-7.24%
jan 1, 1988
14.304
-0.723
-4.81%
jan 1, 1989
9.914
-4.39
-30.69%
jan 1, 1990
8.69
-1.224
-12.35%
jan 1, 1991
8.894
+0.205
2.36%
jan 1, 1992
9.021
+0.127
1.43%
jan 1, 1993
9.746
+0.725
8.04%
jan 1, 1994
15.168
+5.422
55.63%
jan 1, 1995
20.478
+5.31
35.01%
jan 1, 1996
22.062
+1.583
7.73%
jan 1, 1997
22.177
+0.115
0.52%
jan 1, 1998
23.947
+1.77
7.98%
jan 1, 1999
21.905
-2.042
-8.53%
jan 1, 2000
22.411
+0.506
2.31%
jan 1, 2001
26.021
+3.61
16.11%
jan 1, 2002
23.955
-2.065
-7.94%
jan 1, 2003
17.939
-6.016
-25.12%
jan 1, 2004
16.641
-1.297
-7.23%
jan 1, 2005
18.712
+2.071
12.44%
jan 1, 2006
20.298
+1.586
8.48%
jan 1, 2007
21.096
+0.798
3.93%
jan 1, 2008
21.999
+0.903
4.28%
jan 1, 2009
22.508
+0.508
2.31%
jan 1, 2010
22.17
-0.337
-1.5%
jan 1, 2011
24.485
+2.315
10.44%
jan 1, 2012
25.279
+0.793
3.24%
jan 1, 2013
26.083
+0.804
3.18%
jan 1, 2014
26.491
+0.409
1.57%
jan 1, 2015
26.976
+0.484
1.83%
jan 1, 2016
26.883
-0.093
-0.34%
Ranking of countries by current statistics by years


Comments: