29
/
en
AIzaSyAYiBZKx7MnpbEhh9jyipgxe19OcubqV5w
April 1, 2024
256191
Sweden
SWE
true
2
1
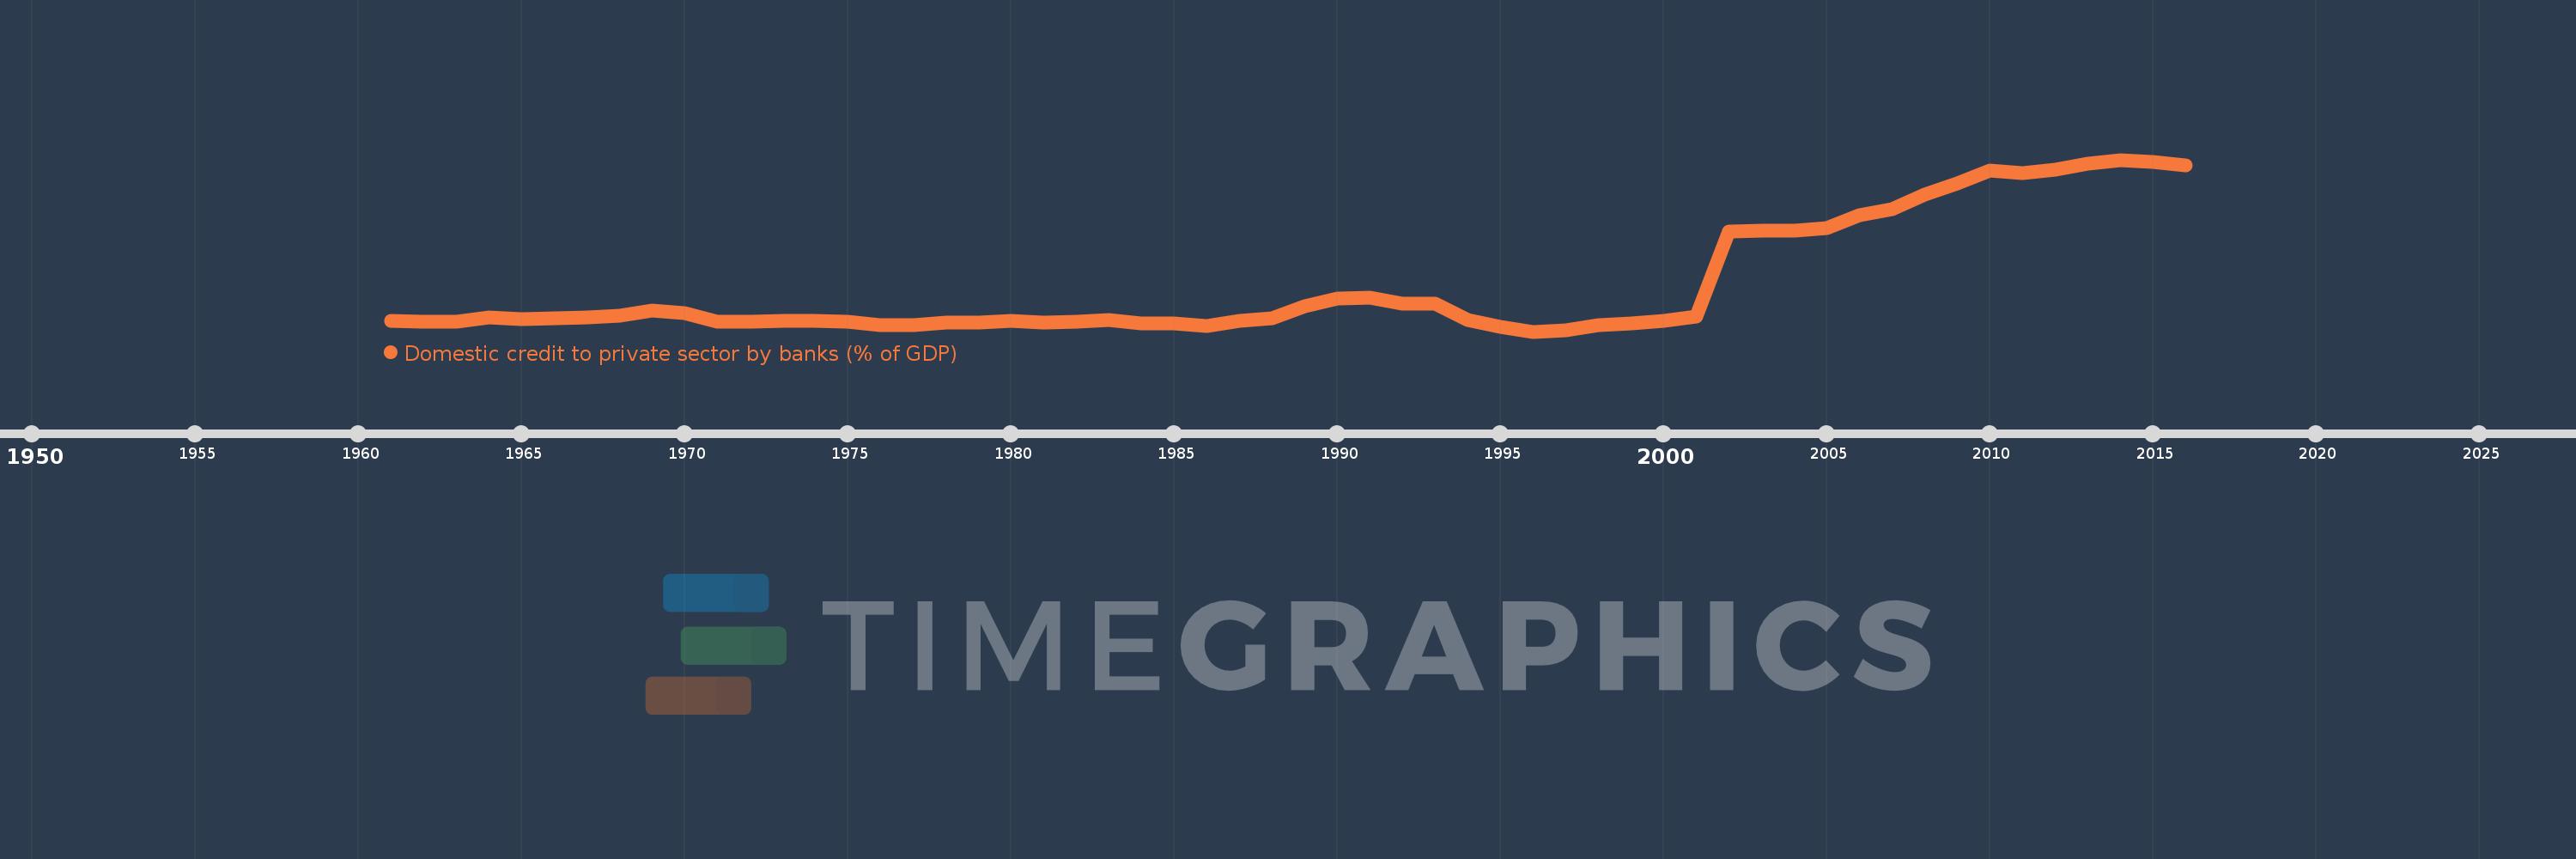
Domestic credit to private sector by banks (% of GDP)
2016,2015,2014,2013,2012,2011,2010,2009,2008,2007,2006,2005,2004,2003,2002,2001,2000,1999,1998,1997,1996,1995,1994,1993,1992,1991,1990,1989,1988,1987,1986,1985,1984,1983,1982,1981,1980,1979,1978,1977,1976,1975,1974,1973,1972,1971,1970,1969,1968,1967,1966,1965,1964,1963,1962,1961
This statistics in other country:
AfghanistanAlbaniaAlgeriaAngolaAntigua and BarbudaArab WorldArgentinaArmeniaArubaAustraliaAustriaAzerbaijanBahamas, TheBahrainBangladeshBarbadosBelarusBelgiumBelizeBeninBhutanBoliviaBosnia and HerzegovinaBotswanaBrazilBrunei DarussalamBulgariaBurkina FasoBurundiCabo VerdeCambodiaCameroonCanadaCaribbean small statesCentral African RepublicCentral Europe and the BalticsChadChileChinaColombiaComorosCongo, Dem. Rep.Congo, Rep.Costa RicaCote d'IvoireCroatiaCyprusCzech RepublicDenmarkDjiboutiDominicaDominican RepublicEarly-demographic dividendEast Asia & PacificEast Asia & Pacific (excluding high income)East Asia & Pacific (IDA & IBRD countries)EcuadorEgypt, Arab Rep.El SalvadorEquatorial GuineaEritreaEstoniaEthiopiaEuro areaEurope & Central AsiaEurope & Central Asia (excluding high income)Europe & Central Asia (IDA & IBRD countries)European UnionFijiFinlandFragile and conflict affected situationsFranceGabonGambia, TheGeorgiaGermanyGhanaGreeceGrenadaGuatemalaGuineaGuinea-BissauGuyanaHaitiHeavily indebted poor countries (HIPC)High incomeHondurasHong Kong SAR, ChinaHungaryIBRD onlyIcelandIDA & IBRD totalIDA blendIDA onlyIDA totalIndiaIndonesiaIran, Islamic Rep.IraqIrelandIsraelItalyJamaicaJapanJordanKazakhstanKenyaKorea, Rep.KosovoKuwaitKyrgyz RepublicLao PDRLate-demographic dividendLatin America & Caribbean Latin America & Caribbean (excluding high income)Latin America & the Caribbean (IDA & IBRD countries)LatviaLeast developed countries: UN classificationLebanonLesothoLiberiaLibyaLithuaniaLow & middle incomeLow incomeLower middle incomeLuxembourgMacao SAR, ChinaMacedonia, FYRMadagascarMalawiMalaysiaMaldivesMaliMaltaMauritaniaMauritiusMexicoMicronesia, Fed. Sts.Middle East & North AfricaMiddle East & North Africa (excluding high income)Middle East & North Africa (IDA & IBRD countries)Middle incomeMoldovaMongoliaMontenegroMoroccoMozambiqueMyanmarNamibiaNepalNetherlandsNew ZealandNicaraguaNigerNigeriaNorth AmericaNorwayOECD membersOmanOther small statesPacific island small statesPakistanPanamaPapua New GuineaParaguayPeruPhilippinesPolandPortugalPost-demographic dividendPre-demographic dividendQatarRomaniaRussian FederationRwandaSamoaSao Tome and PrincipeSaudi ArabiaSenegalSerbiaSeychellesSierra LeoneSingaporeSlovak RepublicSloveniaSmall statesSolomon IslandsSouth AfricaSouth AsiaSouth Asia (IDA & IBRD)South SudanSpainSri LankaSt. Kitts and NevisSt. LuciaSt. Vincent and the GrenadinesSub-Saharan Africa Sub-Saharan Africa (excluding high income)Sub-Saharan Africa (IDA & IBRD countries)SudanSurinameSwazilandSwedenSwitzerlandSyrian Arab RepublicTajikistanTanzaniaThailandTimor-LesteTogoTongaTrinidad and TobagoTunisiaTurkeyUgandaUkraineUnited Arab EmiratesUnited KingdomUnited StatesUpper middle incomeUruguayVanuatuVenezuela, RBVietnamWest Bank and GazaWorldYemen, Rep.ZambiaZimbabwe Timeline:
This timeline shows a graph from 1961 to 2016 of Sweden. No data until 1960. Number of actual observations by date: 56.
Source name:
World Development Indicators
Source organization:
International Monetary Fund, International Financial Statistics and data files, and World Bank and OECD GDP estimates.
Categories, topics:
Financial Sector
Last updated:
apr 23, 2017
Indicators value changes by year
Maximum:
132.233
jan 1, 2014
At the date of observation
Value
Absolute change
Change from previous value
jan 1, 1961
38.111
+38.111
0.0%
jan 1, 1962
37.218
-0.894
-2.34%
jan 1, 1963
37.615
+0.398
1.07%
jan 1, 1964
39.837
+2.222
5.91%
jan 1, 1965
39.164
-0.673
-1.69%
jan 1, 1966
39.672
+0.508
1.3%
jan 1, 1967
39.912
+0.24
0.6%
jan 1, 1968
40.883
+0.971
2.43%
jan 1, 1969
43.989
+3.106
7.6%
jan 1, 1970
42.442
-1.547
-3.52%
jan 1, 1971
37.292
-5.15
-12.13%
jan 1, 1972
37.324
+0.033
0.09%
jan 1, 1973
38.062
+0.738
1.98%
jan 1, 1974
38.204
+0.142
0.37%
jan 1, 1975
37.427
-0.777
-2.03%
jan 1, 1976
35.58
-1.847
-4.94%
jan 1, 1977
35.509
-0.071
-0.2%
jan 1, 1978
37.104
+1.595
4.49%
jan 1, 1979
36.928
-0.177
-0.48%
jan 1, 1980
37.935
+1.007
2.73%
jan 1, 1981
36.991
-0.944
-2.49%
jan 1, 1982
37.238
+0.247
0.67%
jan 1, 1983
38.589
+1.351
3.63%
jan 1, 1984
36.411
-2.178
-5.64%
jan 1, 1985
36.327
-0.084
-0.23%
jan 1, 1986
35.186
-1.142
-3.14%
jan 1, 1987
37.722
+2.537
7.21%
jan 1, 1988
39.676
+1.953
5.18%
jan 1, 1989
46.532
+6.856
17.28%
jan 1, 1990
50.911
+4.379
9.41%
jan 1, 1991
51.778
+0.867
1.7%
jan 1, 1992
48.036
-3.742
-7.23%
jan 1, 1993
48.043
+0.007
0.02%
jan 1, 1994
38.639
-9.405
-19.58%
jan 1, 1995
34.686
-3.952
-10.23%
jan 1, 1996
31.68
-3.006
-8.67%
jan 1, 1997
32.257
+0.577
1.82%
jan 1, 1998
35.214
+2.957
9.17%
jan 1, 1999
36.382
+1.168
3.32%
jan 1, 2000
37.912
+1.53
4.21%
jan 1, 2001
40.275
+2.363
6.23%
jan 1, 2002
90.497
+50.222
124.7%
jan 1, 2003
90.788
+0.292
0.32%
jan 1, 2004
90.714
-0.074
-0.08%
jan 1, 2005
92.317
+1.603
1.77%
jan 1, 2006
99.943
+7.626
8.26%
jan 1, 2007
103.333
+3.39
3.39%
jan 1, 2008
111.761
+8.429
8.16%
jan 1, 2009
118.567
+6.805
6.09%
jan 1, 2010
125.913
+7.346
6.2%
jan 1, 2011
124.384
-1.529
-1.21%
jan 1, 2012
126.413
+2.029
1.63%
jan 1, 2013
130.128
+3.715
2.94%
jan 1, 2014
132.233
+2.105
1.62%
jan 1, 2015
131.202
-1.031
-0.78%
jan 1, 2016
128.938
-2.263
-1.73%
Ranking of countries by current statistics by years


Comments: