29
/
en
AIzaSyAYiBZKx7MnpbEhh9jyipgxe19OcubqV5w
April 1, 2024
121980
Dominican Republic
DOM
true
2
1
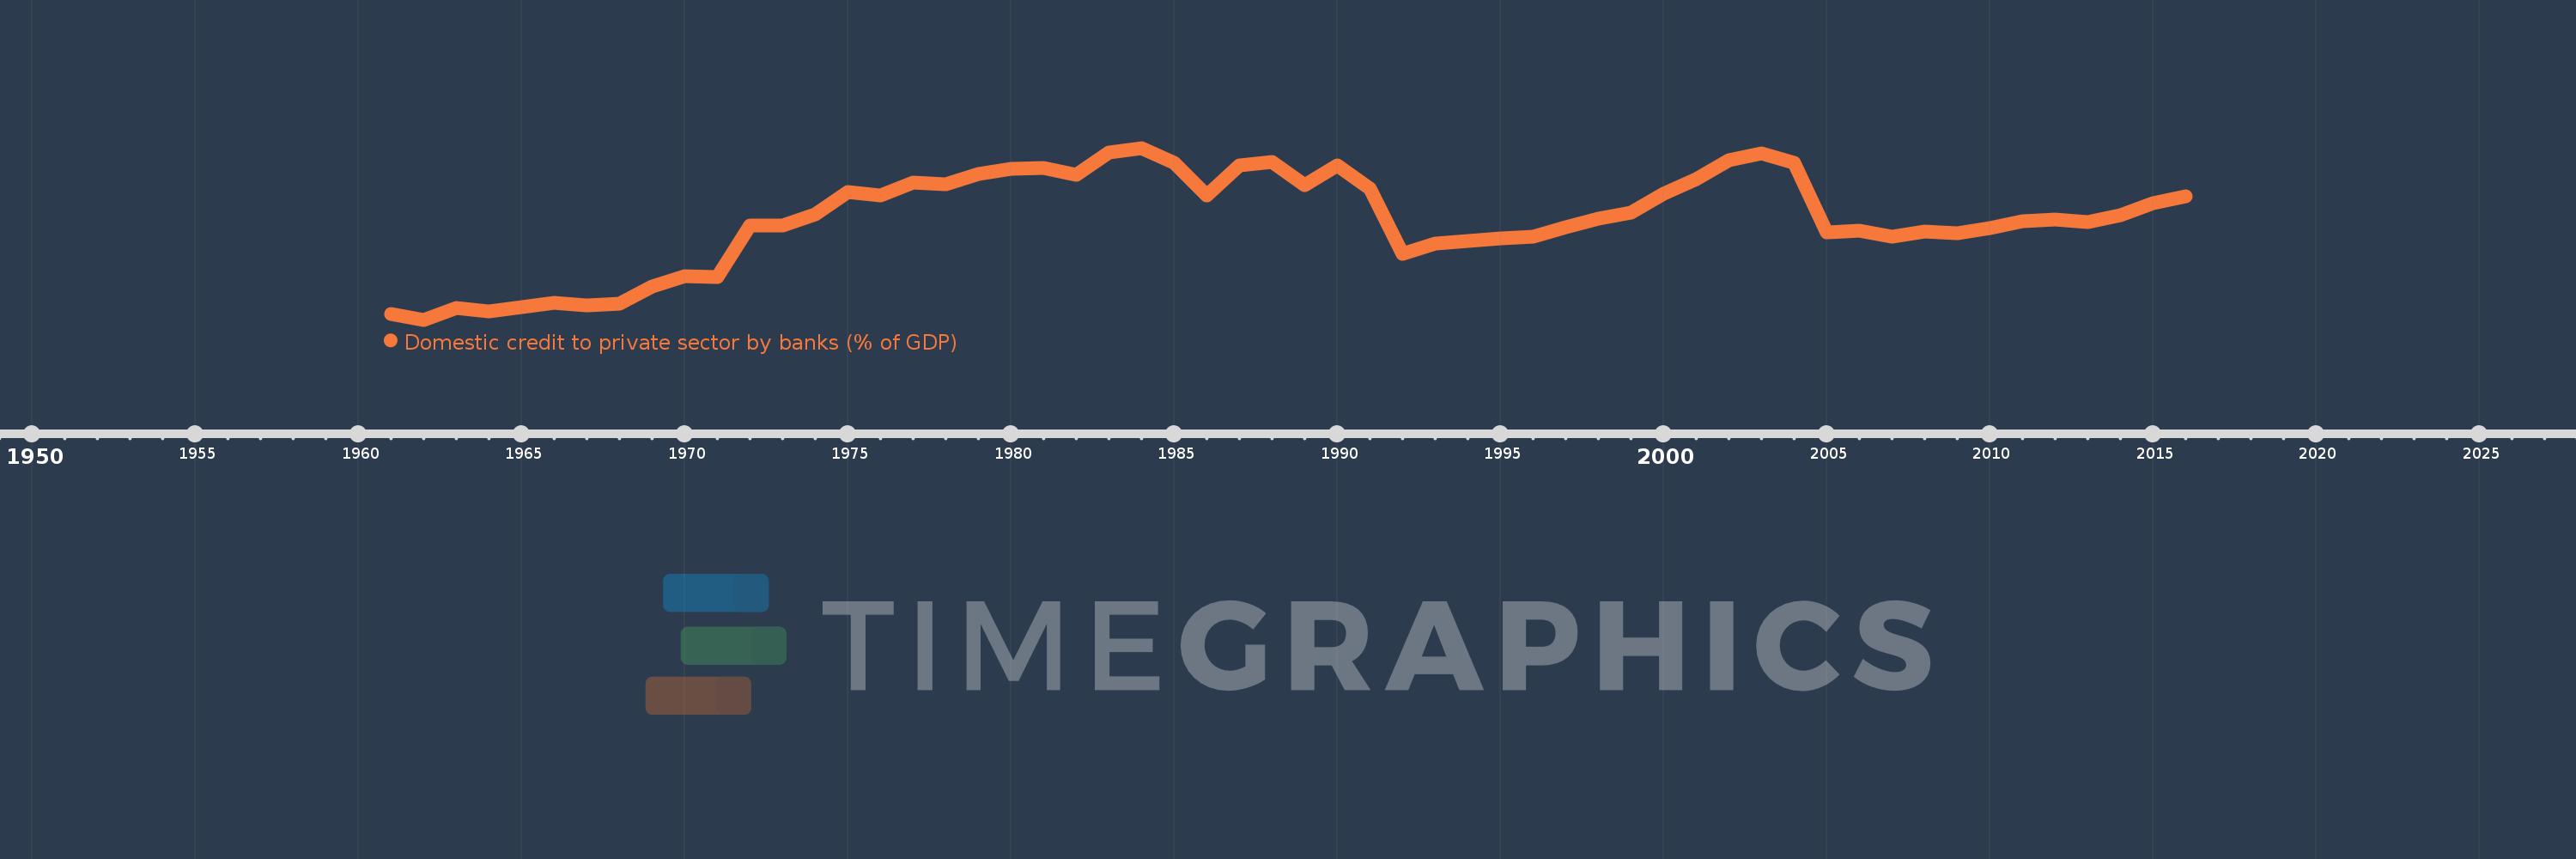
Domestic credit to private sector by banks (% of GDP)
2016,2015,2014,2013,2012,2011,2010,2009,2008,2007,2006,2005,2004,2003,2002,2001,2000,1999,1998,1997,1996,1995,1994,1993,1992,1991,1990,1989,1988,1987,1986,1985,1984,1983,1982,1981,1980,1979,1978,1977,1976,1975,1974,1973,1972,1971,1970,1969,1968,1967,1966,1965,1964,1963,1962,1961
This statistics in other country:
AfghanistanAlbaniaAlgeriaAngolaAntigua and BarbudaArab WorldArgentinaArmeniaArubaAustraliaAustriaAzerbaijanBahamas, TheBahrainBangladeshBarbadosBelarusBelgiumBelizeBeninBhutanBoliviaBosnia and HerzegovinaBotswanaBrazilBrunei DarussalamBulgariaBurkina FasoBurundiCabo VerdeCambodiaCameroonCanadaCaribbean small statesCentral African RepublicCentral Europe and the BalticsChadChileChinaColombiaComorosCongo, Dem. Rep.Congo, Rep.Costa RicaCote d'IvoireCroatiaCyprusCzech RepublicDenmarkDjiboutiDominicaDominican RepublicEarly-demographic dividendEast Asia & PacificEast Asia & Pacific (excluding high income)East Asia & Pacific (IDA & IBRD countries)EcuadorEgypt, Arab Rep.El SalvadorEquatorial GuineaEritreaEstoniaEthiopiaEuro areaEurope & Central AsiaEurope & Central Asia (excluding high income)Europe & Central Asia (IDA & IBRD countries)European UnionFijiFinlandFragile and conflict affected situationsFranceGabonGambia, TheGeorgiaGermanyGhanaGreeceGrenadaGuatemalaGuineaGuinea-BissauGuyanaHaitiHeavily indebted poor countries (HIPC)High incomeHondurasHong Kong SAR, ChinaHungaryIBRD onlyIcelandIDA & IBRD totalIDA blendIDA onlyIDA totalIndiaIndonesiaIran, Islamic Rep.IraqIrelandIsraelItalyJamaicaJapanJordanKazakhstanKenyaKorea, Rep.KosovoKuwaitKyrgyz RepublicLao PDRLate-demographic dividendLatin America & Caribbean Latin America & Caribbean (excluding high income)Latin America & the Caribbean (IDA & IBRD countries)LatviaLeast developed countries: UN classificationLebanonLesothoLiberiaLibyaLithuaniaLow & middle incomeLow incomeLower middle incomeLuxembourgMacao SAR, ChinaMacedonia, FYRMadagascarMalawiMalaysiaMaldivesMaliMaltaMauritaniaMauritiusMexicoMicronesia, Fed. Sts.Middle East & North AfricaMiddle East & North Africa (excluding high income)Middle East & North Africa (IDA & IBRD countries)Middle incomeMoldovaMongoliaMontenegroMoroccoMozambiqueMyanmarNamibiaNepalNetherlandsNew ZealandNicaraguaNigerNigeriaNorth AmericaNorwayOECD membersOmanOther small statesPacific island small statesPakistanPanamaPapua New GuineaParaguayPeruPhilippinesPolandPortugalPost-demographic dividendPre-demographic dividendQatarRomaniaRussian FederationRwandaSamoaSao Tome and PrincipeSaudi ArabiaSenegalSerbiaSeychellesSierra LeoneSingaporeSlovak RepublicSloveniaSmall statesSolomon IslandsSouth AfricaSouth AsiaSouth Asia (IDA & IBRD)South SudanSpainSri LankaSt. Kitts and NevisSt. LuciaSt. Vincent and the GrenadinesSub-Saharan Africa Sub-Saharan Africa (excluding high income)Sub-Saharan Africa (IDA & IBRD countries)SudanSurinameSwazilandSwedenSwitzerlandSyrian Arab RepublicTajikistanTanzaniaThailandTimor-LesteTogoTongaTrinidad and TobagoTunisiaTurkeyUgandaUkraineUnited Arab EmiratesUnited KingdomUnited StatesUpper middle incomeUruguayVanuatuVenezuela, RBVietnamWest Bank and GazaWorldYemen, Rep.ZambiaZimbabwe Timeline:
This timeline shows a graph from 1961 to 2016 of Dominican Republic. No data until 1960. Number of actual observations by date: 56.
Source name:
World Development Indicators
Source organization:
International Monetary Fund, International Financial Statistics and data files, and World Bank and OECD GDP estimates.
Categories, topics:
Financial Sector
Last updated:
apr 23, 2017
Indicators value changes by year
Maximum:
34.333
jan 1, 1984
At the date of observation
Value
Absolute change
Change from previous value
jan 1, 1961
5.845
+5.845
0.0%
jan 1, 1962
4.846
-0.998
-17.08%
jan 1, 1963
6.88
+2.034
41.97%
jan 1, 1964
6.346
-0.535
-7.77%
jan 1, 1965
7.079
+0.733
11.55%
jan 1, 1966
7.691
+0.612
8.64%
jan 1, 1967
7.328
-0.363
-4.71%
jan 1, 1968
7.574
+0.246
3.36%
jan 1, 1969
10.479
+2.905
38.35%
jan 1, 1970
12.332
+1.852
17.68%
jan 1, 1971
12.128
-0.204
-1.65%
jan 1, 1972
20.992
+8.864
73.09%
jan 1, 1973
21.089
+0.097
0.46%
jan 1, 1974
22.981
+1.892
8.97%
jan 1, 1975
26.785
+3.803
16.55%
jan 1, 1976
26.222
-0.563
-2.1%
jan 1, 1977
28.372
+2.15
8.2%
jan 1, 1978
28.097
-0.275
-0.97%
jan 1, 1979
29.808
+1.712
6.09%
jan 1, 1980
30.773
+0.965
3.24%
jan 1, 1981
30.833
+0.06
0.19%
jan 1, 1982
29.773
-1.06
-3.44%
jan 1, 1983
33.565
+3.792
12.74%
jan 1, 1984
34.333
+0.768
2.29%
jan 1, 1985
31.781
-2.552
-7.43%
jan 1, 1986
26.154
-5.627
-17.71%
jan 1, 1987
31.362
+5.208
19.91%
jan 1, 1988
31.913
+0.55
1.76%
jan 1, 1989
27.943
-3.97
-12.44%
jan 1, 1990
31.326
+3.383
12.11%
jan 1, 1991
27.292
-4.034
-12.88%
jan 1, 1992
16.166
-11.126
-40.76%
jan 1, 1993
17.974
+1.808
11.18%
jan 1, 1994
18.376
+0.402
2.24%
jan 1, 1995
18.83
+0.454
2.47%
jan 1, 1996
19.05
+0.22
1.17%
jan 1, 1997
20.654
+1.604
8.42%
jan 1, 1998
22.129
+1.475
7.14%
jan 1, 1999
23.304
+1.175
5.31%
jan 1, 2000
26.546
+3.242
13.91%
jan 1, 2001
28.979
+2.433
9.17%
jan 1, 2002
32.297
+3.318
11.45%
jan 1, 2003
33.369
+1.072
3.32%
jan 1, 2004
31.742
-1.627
-4.88%
jan 1, 2005
19.862
-11.879
-37.43%
jan 1, 2006
20.102
+0.24
1.21%
jan 1, 2007
19.052
-1.05
-5.22%
jan 1, 2008
20.005
+0.953
5.0%
jan 1, 2009
19.758
-0.246
-1.23%
jan 1, 2010
20.529
+0.77
3.9%
jan 1, 2011
21.749
+1.22
5.94%
jan 1, 2012
21.994
+0.245
1.13%
jan 1, 2013
21.54
-0.454
-2.06%
jan 1, 2014
22.818
+1.278
5.93%
jan 1, 2015
24.884
+2.066
9.05%
jan 1, 2016
25.971
+1.087
4.37%
Ranking of countries by current statistics by years


Comments: