29
/
en
AIzaSyAYiBZKx7MnpbEhh9jyipgxe19OcubqV5w
April 1, 2024
72840
Australia
AUS
true
2
1
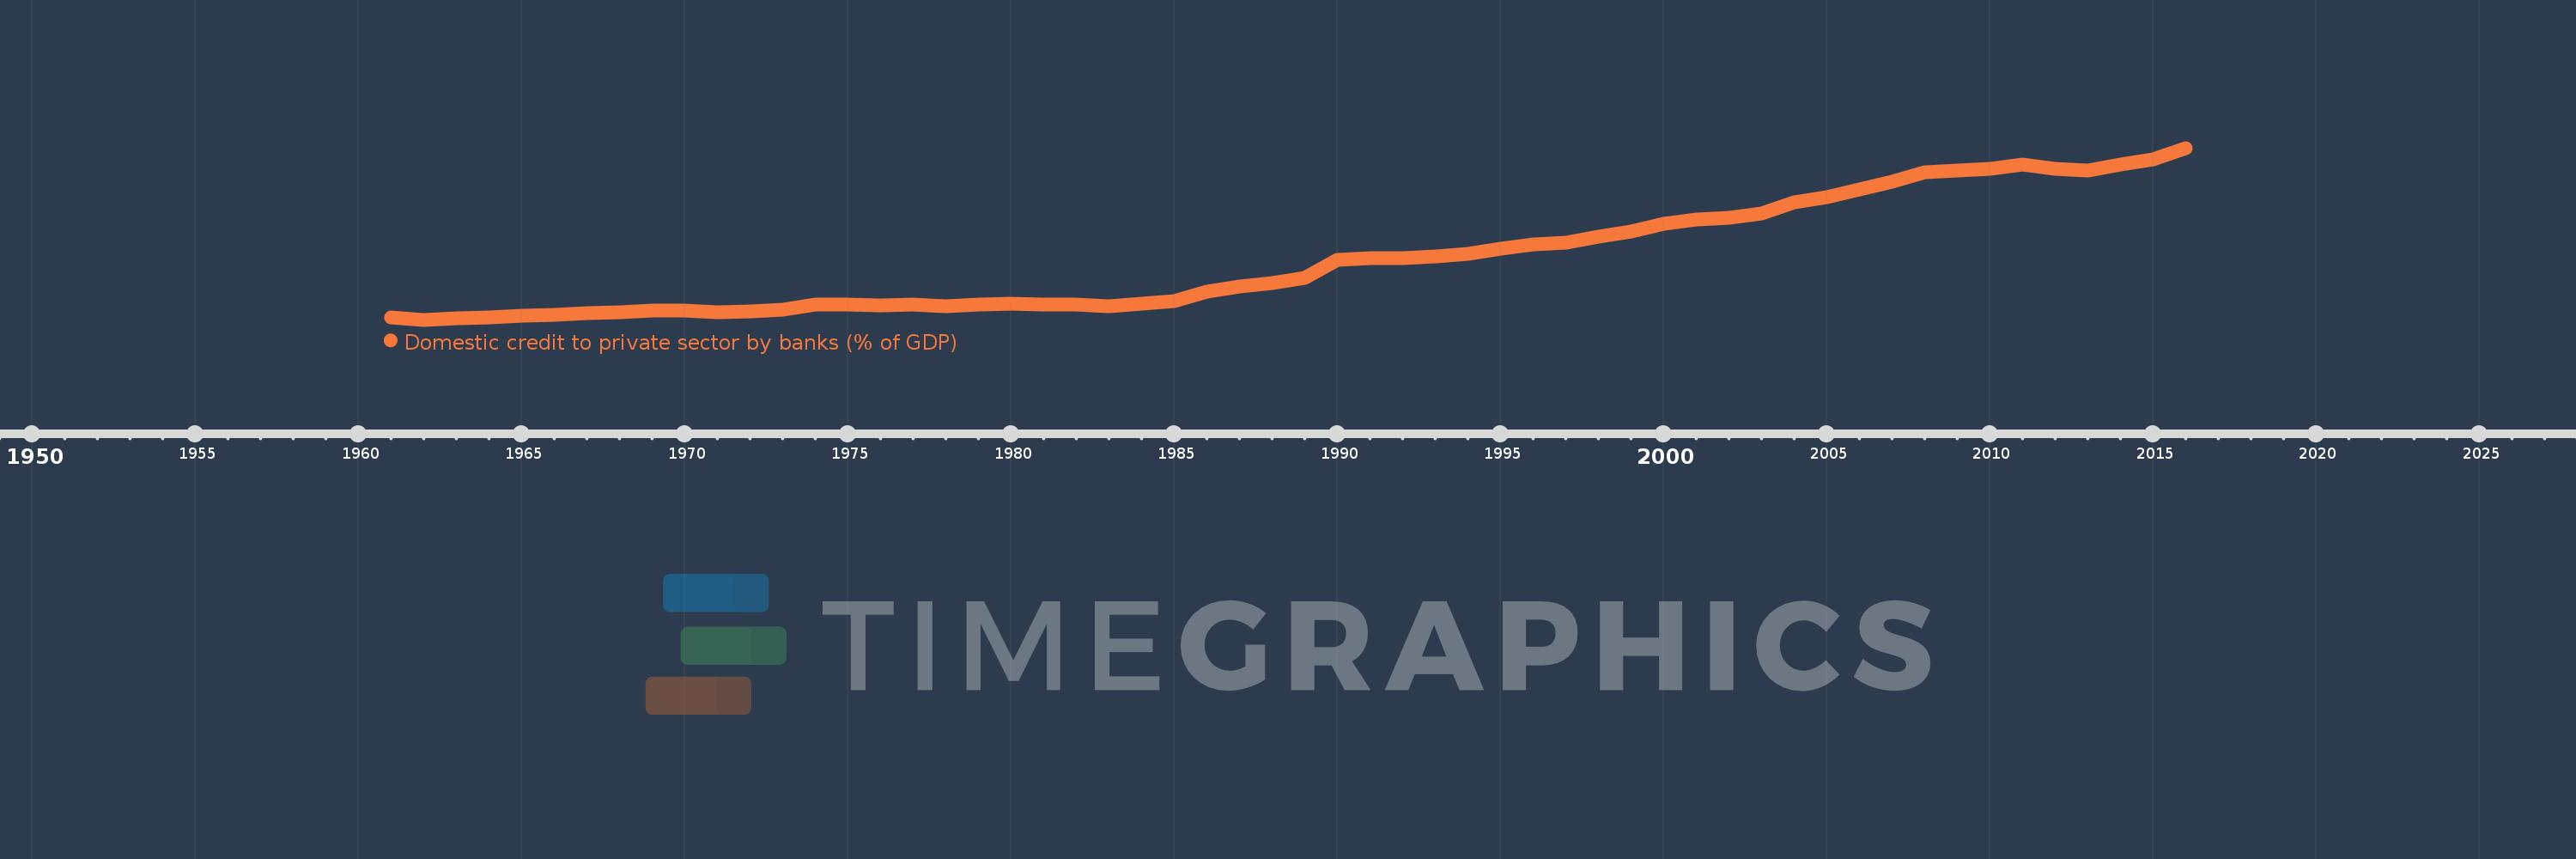
Domestic credit to private sector by banks (% of GDP)
2016,2015,2014,2013,2012,2011,2010,2009,2008,2007,2006,2005,2004,2003,2002,2001,2000,1999,1998,1997,1996,1995,1994,1993,1992,1991,1990,1989,1988,1987,1986,1985,1984,1983,1982,1981,1980,1979,1978,1977,1976,1975,1974,1973,1972,1971,1970,1969,1968,1967,1966,1965,1964,1963,1962,1961
This statistics in other country:
AfghanistanAlbaniaAlgeriaAngolaAntigua and BarbudaArab WorldArgentinaArmeniaArubaAustraliaAustriaAzerbaijanBahamas, TheBahrainBangladeshBarbadosBelarusBelgiumBelizeBeninBhutanBoliviaBosnia and HerzegovinaBotswanaBrazilBrunei DarussalamBulgariaBurkina FasoBurundiCabo VerdeCambodiaCameroonCanadaCaribbean small statesCentral African RepublicCentral Europe and the BalticsChadChileChinaColombiaComorosCongo, Dem. Rep.Congo, Rep.Costa RicaCote d'IvoireCroatiaCyprusCzech RepublicDenmarkDjiboutiDominicaDominican RepublicEarly-demographic dividendEast Asia & PacificEast Asia & Pacific (excluding high income)East Asia & Pacific (IDA & IBRD countries)EcuadorEgypt, Arab Rep.El SalvadorEquatorial GuineaEritreaEstoniaEthiopiaEuro areaEurope & Central AsiaEurope & Central Asia (excluding high income)Europe & Central Asia (IDA & IBRD countries)European UnionFijiFinlandFragile and conflict affected situationsFranceGabonGambia, TheGeorgiaGermanyGhanaGreeceGrenadaGuatemalaGuineaGuinea-BissauGuyanaHaitiHeavily indebted poor countries (HIPC)High incomeHondurasHong Kong SAR, ChinaHungaryIBRD onlyIcelandIDA & IBRD totalIDA blendIDA onlyIDA totalIndiaIndonesiaIran, Islamic Rep.IraqIrelandIsraelItalyJamaicaJapanJordanKazakhstanKenyaKorea, Rep.KosovoKuwaitKyrgyz RepublicLao PDRLate-demographic dividendLatin America & Caribbean Latin America & Caribbean (excluding high income)Latin America & the Caribbean (IDA & IBRD countries)LatviaLeast developed countries: UN classificationLebanonLesothoLiberiaLibyaLithuaniaLow & middle incomeLow incomeLower middle incomeLuxembourgMacao SAR, ChinaMacedonia, FYRMadagascarMalawiMalaysiaMaldivesMaliMaltaMauritaniaMauritiusMexicoMicronesia, Fed. Sts.Middle East & North AfricaMiddle East & North Africa (excluding high income)Middle East & North Africa (IDA & IBRD countries)Middle incomeMoldovaMongoliaMontenegroMoroccoMozambiqueMyanmarNamibiaNepalNetherlandsNew ZealandNicaraguaNigerNigeriaNorth AmericaNorwayOECD membersOmanOther small statesPacific island small statesPakistanPanamaPapua New GuineaParaguayPeruPhilippinesPolandPortugalPost-demographic dividendPre-demographic dividendQatarRomaniaRussian FederationRwandaSamoaSao Tome and PrincipeSaudi ArabiaSenegalSerbiaSeychellesSierra LeoneSingaporeSlovak RepublicSloveniaSmall statesSolomon IslandsSouth AfricaSouth AsiaSouth Asia (IDA & IBRD)South SudanSpainSri LankaSt. Kitts and NevisSt. LuciaSt. Vincent and the GrenadinesSub-Saharan Africa Sub-Saharan Africa (excluding high income)Sub-Saharan Africa (IDA & IBRD countries)SudanSurinameSwazilandSwedenSwitzerlandSyrian Arab RepublicTajikistanTanzaniaThailandTimor-LesteTogoTongaTrinidad and TobagoTunisiaTurkeyUgandaUkraineUnited Arab EmiratesUnited KingdomUnited StatesUpper middle incomeUruguayVanuatuVenezuela, RBVietnamWest Bank and GazaWorldYemen, Rep.ZambiaZimbabwe Timeline:
This timeline shows a graph from 1961 to 2016 of Australia. No data until 1960. Number of actual observations by date: 56.
Source name:
World Development Indicators
Source organization:
International Monetary Fund, International Financial Statistics and data files, and World Bank and OECD GDP estimates.
Categories, topics:
Financial Sector
Last updated:
apr 23, 2017
Indicators value changes by year
Minimum:
17.288
jan 1, 1962
Maximum:
137.644
jan 1, 2016
At the date of observation
Value
Absolute change
Change from previous value
jan 1, 1961
18.737
+18.737
0.0%
jan 1, 1962
17.288
-1.449
-7.73%
jan 1, 1963
18.564
+1.276
7.38%
jan 1, 1964
19.197
+0.633
3.41%
jan 1, 1965
19.944
+0.747
3.89%
jan 1, 1966
20.641
+0.698
3.5%
jan 1, 1967
22.043
+1.401
6.79%
jan 1, 1968
22.365
+0.322
1.46%
jan 1, 1969
23.572
+1.207
5.4%
jan 1, 1970
23.621
+0.049
0.21%
jan 1, 1971
22.312
-1.309
-5.54%
jan 1, 1972
23.049
+0.737
3.3%
jan 1, 1973
24.275
+1.226
5.32%
jan 1, 1974
28.185
+3.911
16.11%
jan 1, 1975
27.697
-0.489
-1.73%
jan 1, 1976
27.177
-0.519
-1.87%
jan 1, 1977
27.77
+0.593
2.18%
jan 1, 1978
26.943
-0.828
-2.98%
jan 1, 1979
27.88
+0.938
3.48%
jan 1, 1980
28.548
+0.668
2.4%
jan 1, 1981
27.707
-0.841
-2.94%
jan 1, 1982
27.749
+0.041
0.15%
jan 1, 1983
26.933
-0.816
-2.94%
jan 1, 1984
28.656
+1.723
6.4%
jan 1, 1985
30.294
+1.639
5.72%
jan 1, 1986
37.032
+6.738
22.24%
jan 1, 1987
40.377
+3.344
9.03%
jan 1, 1988
42.868
+2.491
6.17%
jan 1, 1989
46.791
+3.923
9.15%
jan 1, 1990
59.333
+12.542
26.8%
jan 1, 1991
60.648
+1.316
2.22%
jan 1, 1992
60.19
-0.459
-0.76%
jan 1, 1993
61.912
+1.722
2.86%
jan 1, 1994
63.317
+1.406
2.27%
jan 1, 1995
66.769
+3.452
5.45%
jan 1, 1996
69.815
+3.046
4.56%
jan 1, 1997
71.498
+1.683
2.41%
jan 1, 1998
75.331
+3.833
5.36%
jan 1, 1999
79.186
+3.855
5.12%
jan 1, 2000
84.266
+5.08
6.42%
jan 1, 2001
87.793
+3.527
4.19%
jan 1, 2002
88.632
+0.839
0.96%
jan 1, 2003
91.588
+2.956
3.33%
jan 1, 2004
99.43
+7.842
8.56%
jan 1, 2005
102.941
+3.51
3.53%
jan 1, 2006
108.846
+5.906
5.74%
jan 1, 2007
113.835
+4.989
4.58%
jan 1, 2008
120.788
+6.953
6.11%
jan 1, 2009
121.888
+1.1
0.91%
jan 1, 2010
122.798
+0.91
0.75%
jan 1, 2011
125.923
+3.125
2.54%
jan 1, 2012
122.927
-2.996
-2.38%
jan 1, 2013
121.968
-0.959
-0.78%
jan 1, 2014
125.758
+3.79
3.11%
jan 1, 2015
129.638
+3.88
3.09%
jan 1, 2016
137.644
+8.005
6.18%
Ranking of countries by current statistics by years


Comments: