29
/
en
AIzaSyAYiBZKx7MnpbEhh9jyipgxe19OcubqV5w
April 1, 2024
97223
Cabo Verde
CPV
true
2
1
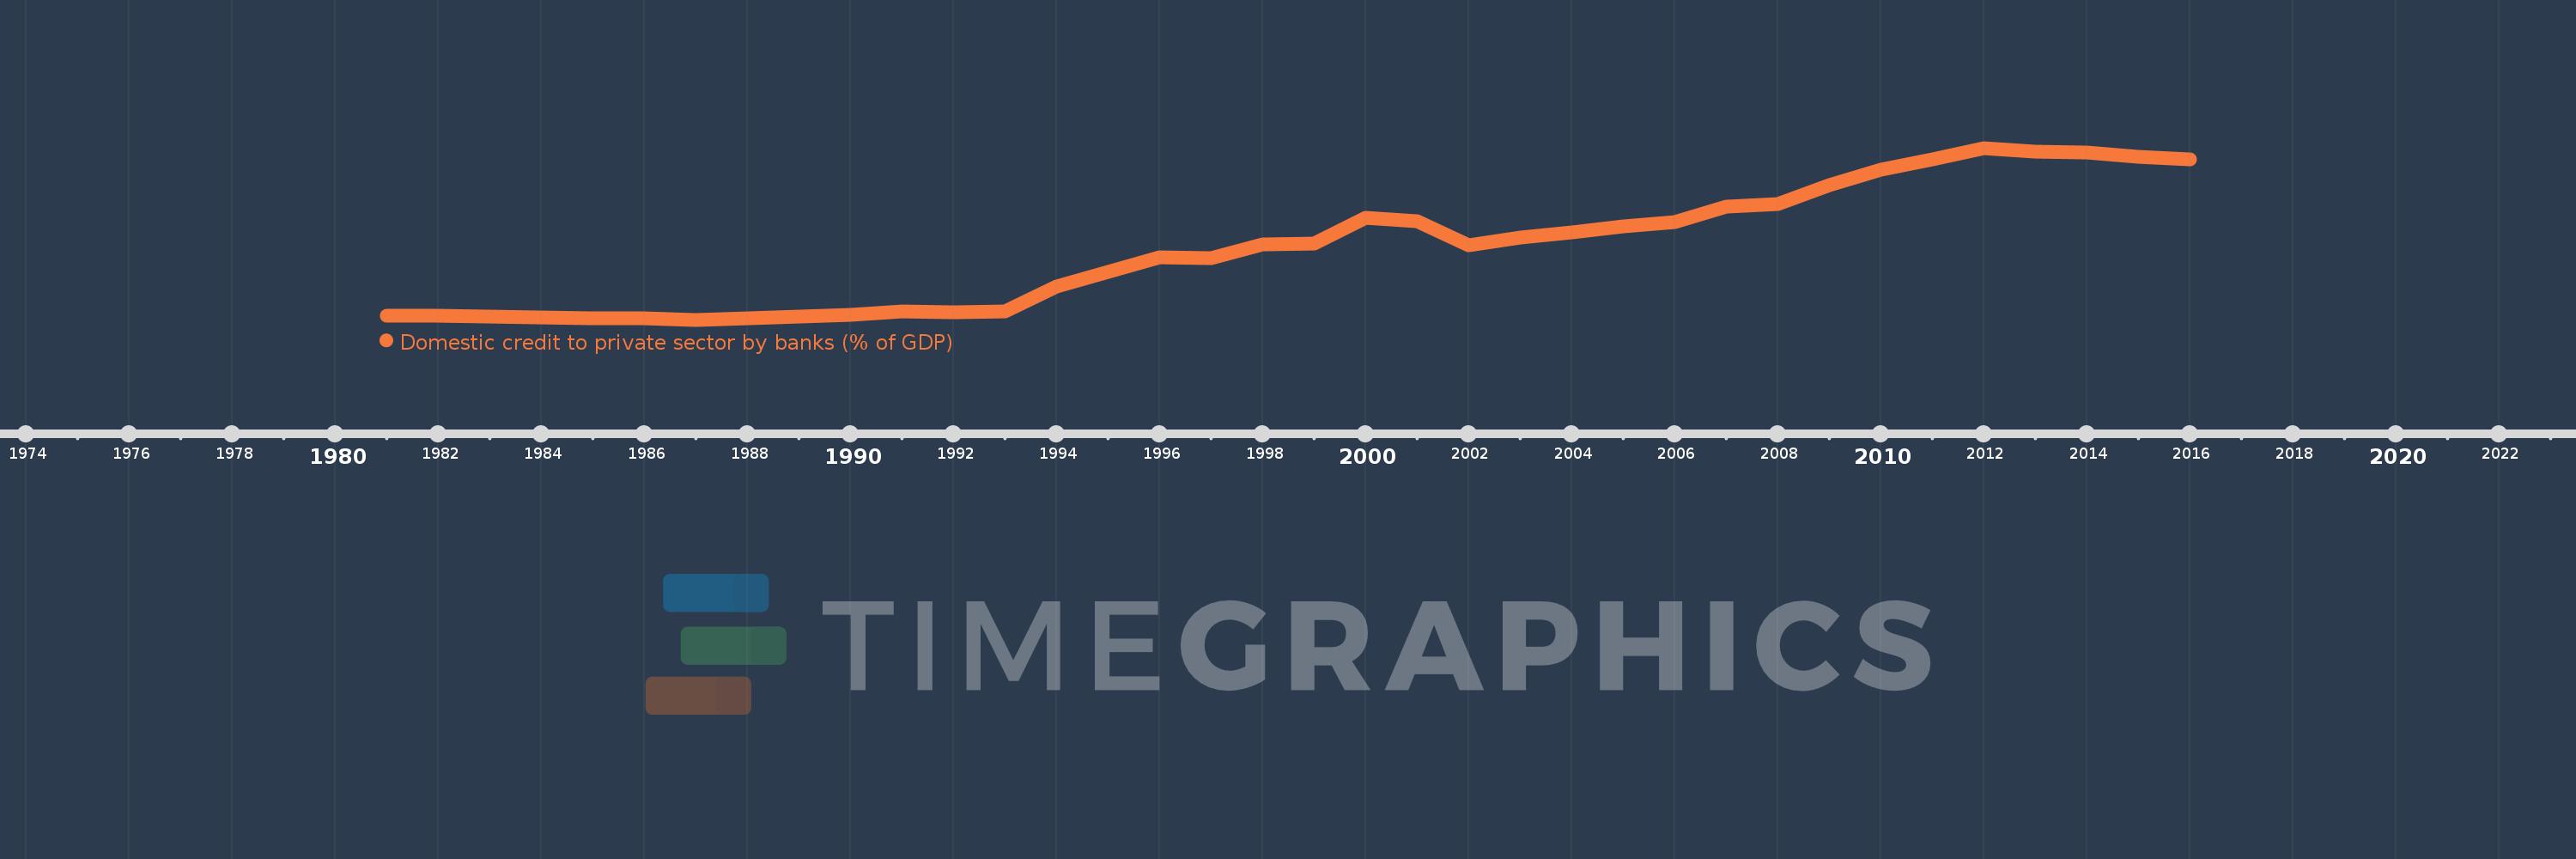
Domestic credit to private sector by banks (% of GDP)
2016,2015,2014,2013,2012,2011,2010,2009,2008,2007,2006,2005,2004,2003,2002,2001,2000,1999,1998,1997,1996,1995,1994,1993,1992,1991,1990,1989,1988,1987,1986,1985,1984,1983,1982,1981
This statistics in other country:
AfghanistanAlbaniaAlgeriaAngolaAntigua and BarbudaArab WorldArgentinaArmeniaArubaAustraliaAustriaAzerbaijanBahamas, TheBahrainBangladeshBarbadosBelarusBelgiumBelizeBeninBhutanBoliviaBosnia and HerzegovinaBotswanaBrazilBrunei DarussalamBulgariaBurkina FasoBurundiCabo VerdeCambodiaCameroonCanadaCaribbean small statesCentral African RepublicCentral Europe and the BalticsChadChileChinaColombiaComorosCongo, Dem. Rep.Congo, Rep.Costa RicaCote d'IvoireCroatiaCyprusCzech RepublicDenmarkDjiboutiDominicaDominican RepublicEarly-demographic dividendEast Asia & PacificEast Asia & Pacific (excluding high income)East Asia & Pacific (IDA & IBRD countries)EcuadorEgypt, Arab Rep.El SalvadorEquatorial GuineaEritreaEstoniaEthiopiaEuro areaEurope & Central AsiaEurope & Central Asia (excluding high income)Europe & Central Asia (IDA & IBRD countries)European UnionFijiFinlandFragile and conflict affected situationsFranceGabonGambia, TheGeorgiaGermanyGhanaGreeceGrenadaGuatemalaGuineaGuinea-BissauGuyanaHaitiHeavily indebted poor countries (HIPC)High incomeHondurasHong Kong SAR, ChinaHungaryIBRD onlyIcelandIDA & IBRD totalIDA blendIDA onlyIDA totalIndiaIndonesiaIran, Islamic Rep.IraqIrelandIsraelItalyJamaicaJapanJordanKazakhstanKenyaKorea, Rep.KosovoKuwaitKyrgyz RepublicLao PDRLate-demographic dividendLatin America & Caribbean Latin America & Caribbean (excluding high income)Latin America & the Caribbean (IDA & IBRD countries)LatviaLeast developed countries: UN classificationLebanonLesothoLiberiaLibyaLithuaniaLow & middle incomeLow incomeLower middle incomeLuxembourgMacao SAR, ChinaMacedonia, FYRMadagascarMalawiMalaysiaMaldivesMaliMaltaMauritaniaMauritiusMexicoMicronesia, Fed. Sts.Middle East & North AfricaMiddle East & North Africa (excluding high income)Middle East & North Africa (IDA & IBRD countries)Middle incomeMoldovaMongoliaMontenegroMoroccoMozambiqueMyanmarNamibiaNepalNetherlandsNew ZealandNicaraguaNigerNigeriaNorth AmericaNorwayOECD membersOmanOther small statesPacific island small statesPakistanPanamaPapua New GuineaParaguayPeruPhilippinesPolandPortugalPost-demographic dividendPre-demographic dividendQatarRomaniaRussian FederationRwandaSamoaSao Tome and PrincipeSaudi ArabiaSenegalSerbiaSeychellesSierra LeoneSingaporeSlovak RepublicSloveniaSmall statesSolomon IslandsSouth AfricaSouth AsiaSouth Asia (IDA & IBRD)South SudanSpainSri LankaSt. Kitts and NevisSt. LuciaSt. Vincent and the GrenadinesSub-Saharan Africa Sub-Saharan Africa (excluding high income)Sub-Saharan Africa (IDA & IBRD countries)SudanSurinameSwazilandSwedenSwitzerlandSyrian Arab RepublicTajikistanTanzaniaThailandTimor-LesteTogoTongaTrinidad and TobagoTunisiaTurkeyUgandaUkraineUnited Arab EmiratesUnited KingdomUnited StatesUpper middle incomeUruguayVanuatuVenezuela, RBVietnamWest Bank and GazaWorldYemen, Rep.ZambiaZimbabwe Timeline:
This timeline shows a graph from 1981 to 2016 of Cabo Verde. No data until 1980. Number of actual observations by date: 36.
Source name:
World Development Indicators
Source organization:
International Monetary Fund, International Financial Statistics and data files, and World Bank and OECD GDP estimates.
Categories, topics:
Financial Sector
Last updated:
apr 23, 2017
Indicators value changes by year
Maximum:
65.278
jan 1, 2012
At the date of observation
Value
Absolute change
Change from previous value
jan 1, 1981
3.118
+3.118
0.0%
jan 1, 1982
3.2
+0.081
2.61%
jan 1, 1983
2.808
-0.392
-12.24%
jan 1, 1984
2.676
-0.132
-4.72%
jan 1, 1985
2.072
-0.603
-22.55%
jan 1, 1986
2.173
+0.1
4.85%
jan 1, 1987
1.664
-0.509
-23.43%
jan 1, 1988
2.22
+0.557
33.46%
jan 1, 1989
2.88
+0.659
29.7%
jan 1, 1990
3.44
+0.561
19.48%
jan 1, 1991
4.715
+1.274
37.04%
jan 1, 1992
4.449
-0.266
-5.63%
jan 1, 1993
4.637
+0.188
4.22%
jan 1, 1994
13.934
+9.297
200.51%
jan 1, 1995
19.444
+5.51
39.55%
jan 1, 1996
24.819
+5.375
27.65%
jan 1, 1997
24.396
-0.424
-1.71%
jan 1, 1998
29.639
+5.244
21.5%
jan 1, 1999
29.882
+0.243
0.82%
jan 1, 2000
39.292
+9.41
31.49%
jan 1, 2001
38.249
-1.043
-2.65%
jan 1, 2002
29.244
-9.005
-23.54%
jan 1, 2003
32.261
+3.017
10.32%
jan 1, 2004
34.054
+1.793
5.56%
jan 1, 2005
36.334
+2.281
6.7%
jan 1, 2006
37.681
+1.346
3.71%
jan 1, 2007
43.607
+5.927
15.73%
jan 1, 2008
44.595
+0.988
2.27%
jan 1, 2009
51.476
+6.88
15.43%
jan 1, 2010
57.147
+5.671
11.02%
jan 1, 2011
60.986
+3.839
6.72%
jan 1, 2012
65.278
+4.292
7.04%
jan 1, 2013
63.846
-1.432
-2.19%
jan 1, 2014
63.678
-0.168
-0.26%
jan 1, 2015
62.01
-1.668
-2.62%
jan 1, 2016
61.103
-0.907
-1.46%
Ranking of countries by current statistics by years


Comments: