29
/
en
AIzaSyAYiBZKx7MnpbEhh9jyipgxe19OcubqV5w
April 1, 2024
31479
Europe & Central Asia (excluding high income)
ECA
false
2
1
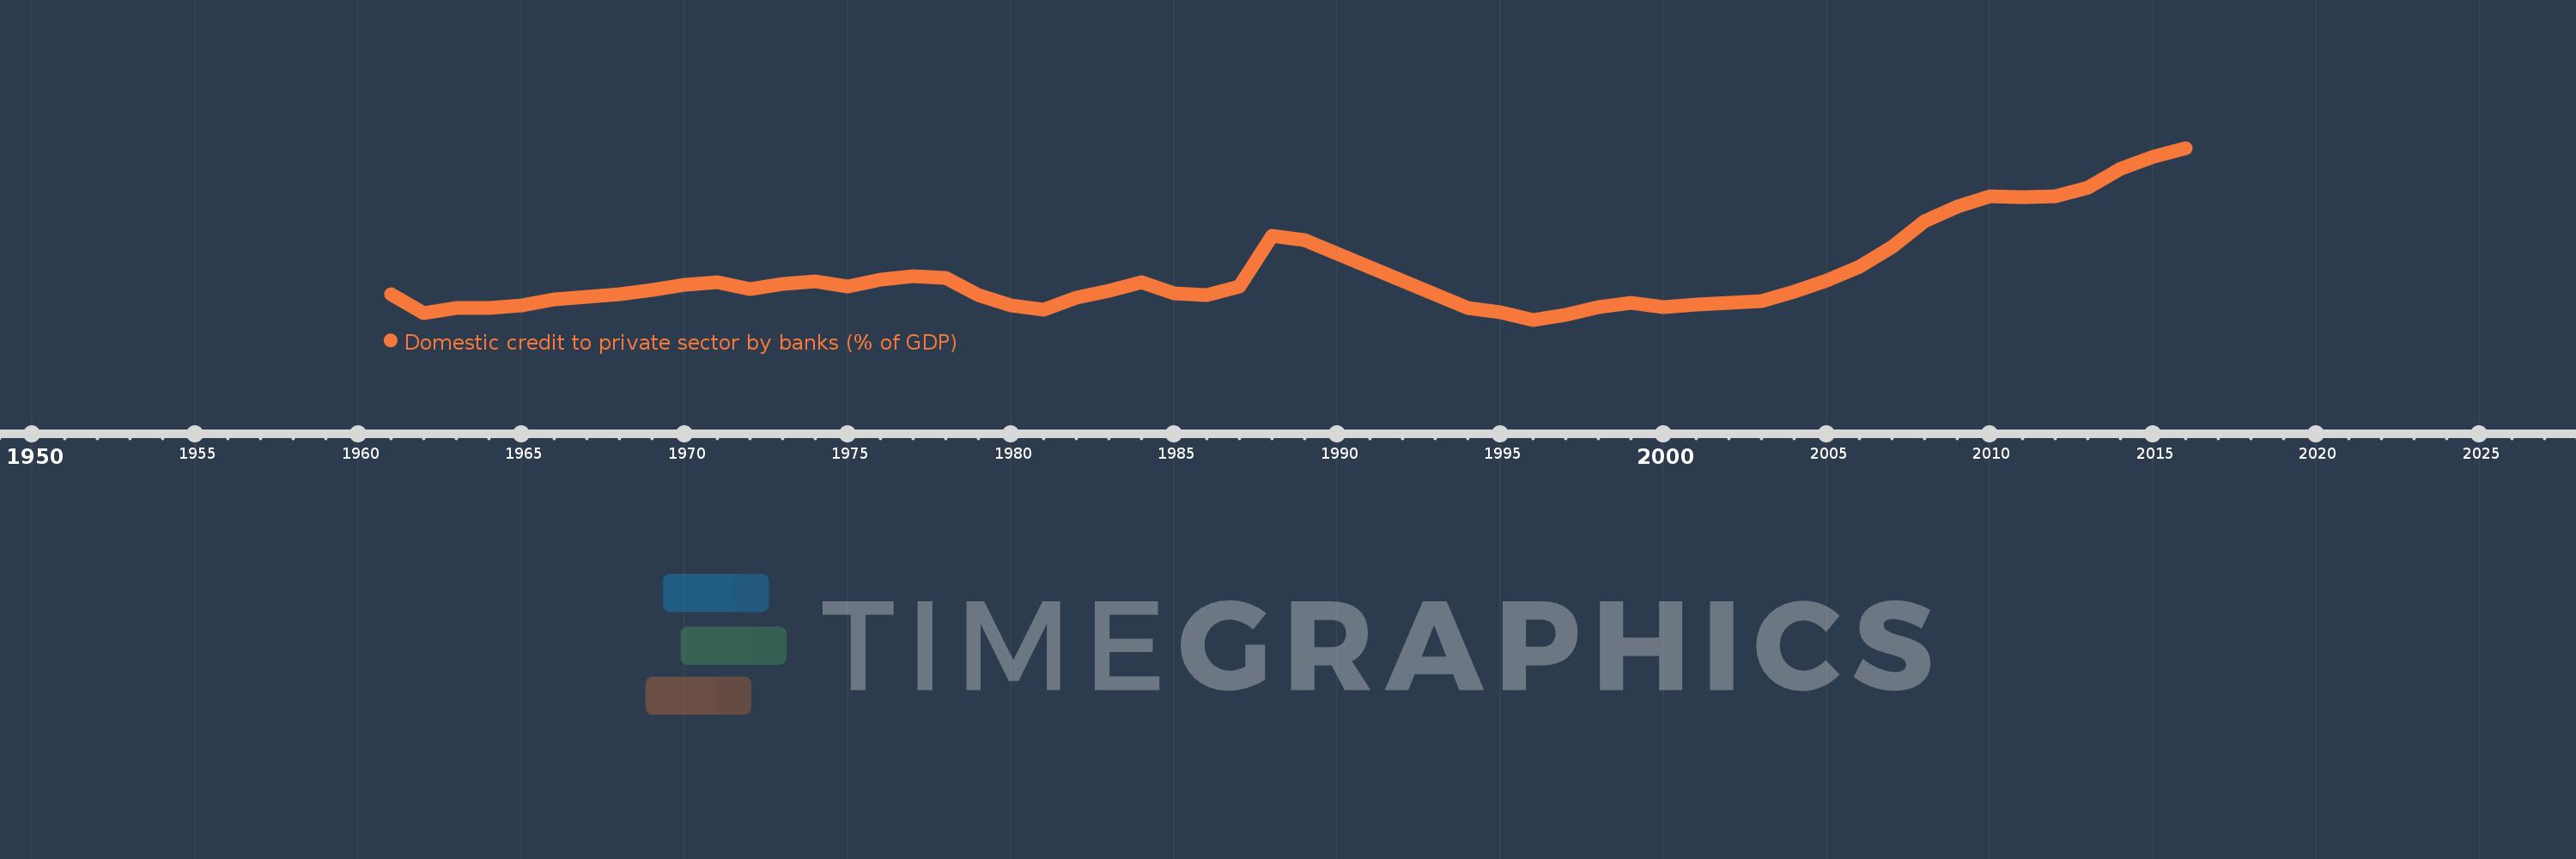
Domestic credit to private sector by banks (% of GDP)
2016,2015,2014,2013,2012,2011,2010,2009,2008,2007,2006,2005,2004,2003,2002,2001,2000,1999,1998,1997,1996,1995,1994,1989,1988,1987,1986,1985,1984,1983,1982,1981,1980,1979,1978,1977,1976,1975,1974,1973,1972,1971,1970,1969,1968,1967,1966,1965,1964,1963,1962,1961
This statistics in other country:
AfghanistanAlbaniaAlgeriaAngolaAntigua and BarbudaArab WorldArgentinaArmeniaArubaAustraliaAustriaAzerbaijanBahamas, TheBahrainBangladeshBarbadosBelarusBelgiumBelizeBeninBhutanBoliviaBosnia and HerzegovinaBotswanaBrazilBrunei DarussalamBulgariaBurkina FasoBurundiCabo VerdeCambodiaCameroonCanadaCaribbean small statesCentral African RepublicCentral Europe and the BalticsChadChileChinaColombiaComorosCongo, Dem. Rep.Congo, Rep.Costa RicaCote d'IvoireCroatiaCyprusCzech RepublicDenmarkDjiboutiDominicaDominican RepublicEarly-demographic dividendEast Asia & PacificEast Asia & Pacific (excluding high income)East Asia & Pacific (IDA & IBRD countries)EcuadorEgypt, Arab Rep.El SalvadorEquatorial GuineaEritreaEstoniaEthiopiaEuro areaEurope & Central AsiaEurope & Central Asia (excluding high income)Europe & Central Asia (IDA & IBRD countries)European UnionFijiFinlandFragile and conflict affected situationsFranceGabonGambia, TheGeorgiaGermanyGhanaGreeceGrenadaGuatemalaGuineaGuinea-BissauGuyanaHaitiHeavily indebted poor countries (HIPC)High incomeHondurasHong Kong SAR, ChinaHungaryIBRD onlyIcelandIDA & IBRD totalIDA blendIDA onlyIDA totalIndiaIndonesiaIran, Islamic Rep.IraqIrelandIsraelItalyJamaicaJapanJordanKazakhstanKenyaKorea, Rep.KosovoKuwaitKyrgyz RepublicLao PDRLate-demographic dividendLatin America & Caribbean Latin America & Caribbean (excluding high income)Latin America & the Caribbean (IDA & IBRD countries)LatviaLeast developed countries: UN classificationLebanonLesothoLiberiaLibyaLithuaniaLow & middle incomeLow incomeLower middle incomeLuxembourgMacao SAR, ChinaMacedonia, FYRMadagascarMalawiMalaysiaMaldivesMaliMaltaMauritaniaMauritiusMexicoMicronesia, Fed. Sts.Middle East & North AfricaMiddle East & North Africa (excluding high income)Middle East & North Africa (IDA & IBRD countries)Middle incomeMoldovaMongoliaMontenegroMoroccoMozambiqueMyanmarNamibiaNepalNetherlandsNew ZealandNicaraguaNigerNigeriaNorth AmericaNorwayOECD membersOmanOther small statesPacific island small statesPakistanPanamaPapua New GuineaParaguayPeruPhilippinesPolandPortugalPost-demographic dividendPre-demographic dividendQatarRomaniaRussian FederationRwandaSamoaSao Tome and PrincipeSaudi ArabiaSenegalSerbiaSeychellesSierra LeoneSingaporeSlovak RepublicSloveniaSmall statesSolomon IslandsSouth AfricaSouth AsiaSouth Asia (IDA & IBRD)South SudanSpainSri LankaSt. Kitts and NevisSt. LuciaSt. Vincent and the GrenadinesSub-Saharan Africa Sub-Saharan Africa (excluding high income)Sub-Saharan Africa (IDA & IBRD countries)SudanSurinameSwazilandSwedenSwitzerlandSyrian Arab RepublicTajikistanTanzaniaThailandTimor-LesteTogoTongaTrinidad and TobagoTunisiaTurkeyUgandaUkraineUnited Arab EmiratesUnited KingdomUnited StatesUpper middle incomeUruguayVanuatuVenezuela, RBVietnamWest Bank and GazaWorldYemen, Rep.ZambiaZimbabwe Timeline:
This timeline shows a graph from 1961 to 2016 of Europe & Central Asia (excluding high income). No data until 1960. Number of actual observations by date: 52.
Source name:
World Development Indicators
Source organization:
International Monetary Fund, International Financial Statistics and data files, and World Bank and OECD GDP estimates.
Categories, topics:
Financial Sector
Last updated:
apr 23, 2017
Indicators value changes by year
Minimum:
10.946
jan 1, 1996
Maximum:
55.702
jan 1, 2016
At the date of observation
Value
Absolute change
Change from previous value
jan 1, 1961
17.651
+17.651
0.0%
jan 1, 1962
12.673
-4.977
-28.2%
jan 1, 1963
14.11
+1.436
11.33%
jan 1, 1964
14.056
-0.054
-0.38%
jan 1, 1965
14.702
+0.646
4.6%
jan 1, 1966
16.242
+1.54
10.48%
jan 1, 1967
16.979
+0.737
4.54%
jan 1, 1968
17.645
+0.667
3.93%
jan 1, 1969
18.603
+0.958
5.43%
jan 1, 1970
20.103
+1.5
8.06%
jan 1, 1971
20.633
+0.53
2.64%
jan 1, 1972
18.882
-1.751
-8.48%
jan 1, 1973
20.33
+1.447
7.66%
jan 1, 1974
20.949
+0.62
3.05%
jan 1, 1975
19.662
-1.288
-6.15%
jan 1, 1976
21.384
+1.722
8.76%
jan 1, 1977
22.187
+0.803
3.76%
jan 1, 1978
21.952
-0.235
-1.06%
jan 1, 1979
17.455
-4.498
-20.49%
jan 1, 1980
14.693
-2.762
-15.82%
jan 1, 1981
13.588
-1.104
-7.52%
jan 1, 1982
16.647
+3.058
22.51%
jan 1, 1983
18.483
+1.836
11.03%
jan 1, 1984
20.76
+2.278
12.32%
jan 1, 1985
17.846
-2.914
-14.04%
jan 1, 1986
17.426
-0.421
-2.36%
jan 1, 1987
19.654
+2.228
12.79%
jan 1, 1988
32.852
+13.198
67.15%
jan 1, 1989
31.728
-1.124
-3.42%
jan 1, 1994
14.071
-17.657
-55.65%
jan 1, 1995
12.949
-1.122
-7.97%
jan 1, 1996
10.946
-2.003
-15.47%
jan 1, 1997
12.312
+1.366
12.47%
jan 1, 1998
14.164
+1.852
15.04%
jan 1, 1999
15.333
+1.169
8.26%
jan 1, 2000
14.307
-1.027
-6.7%
jan 1, 2001
14.945
+0.639
4.46%
jan 1, 2002
15.312
+0.367
2.45%
jan 1, 2003
15.865
+0.553
3.61%
jan 1, 2004
18.247
+2.382
15.01%
jan 1, 2005
21.175
+2.927
16.04%
jan 1, 2006
24.679
+3.505
16.55%
jan 1, 2007
29.933
+5.253
21.29%
jan 1, 2008
36.709
+6.776
22.64%
jan 1, 2009
40.496
+3.787
10.32%
jan 1, 2010
43.108
+2.613
6.45%
jan 1, 2011
42.866
-0.242
-0.56%
jan 1, 2012
43.057
+0.19
0.44%
jan 1, 2013
45.343
+2.286
5.31%
jan 1, 2014
50.212
+4.869
10.74%
jan 1, 2015
53.467
+3.255
6.48%
jan 1, 2016
55.702
+2.235
4.18%
Ranking of countries by current statistics by years


Comments: