29
/
en
AIzaSyAYiBZKx7MnpbEhh9jyipgxe19OcubqV5w
April 1, 2024
65858
Algeria
DZA
true
2
1
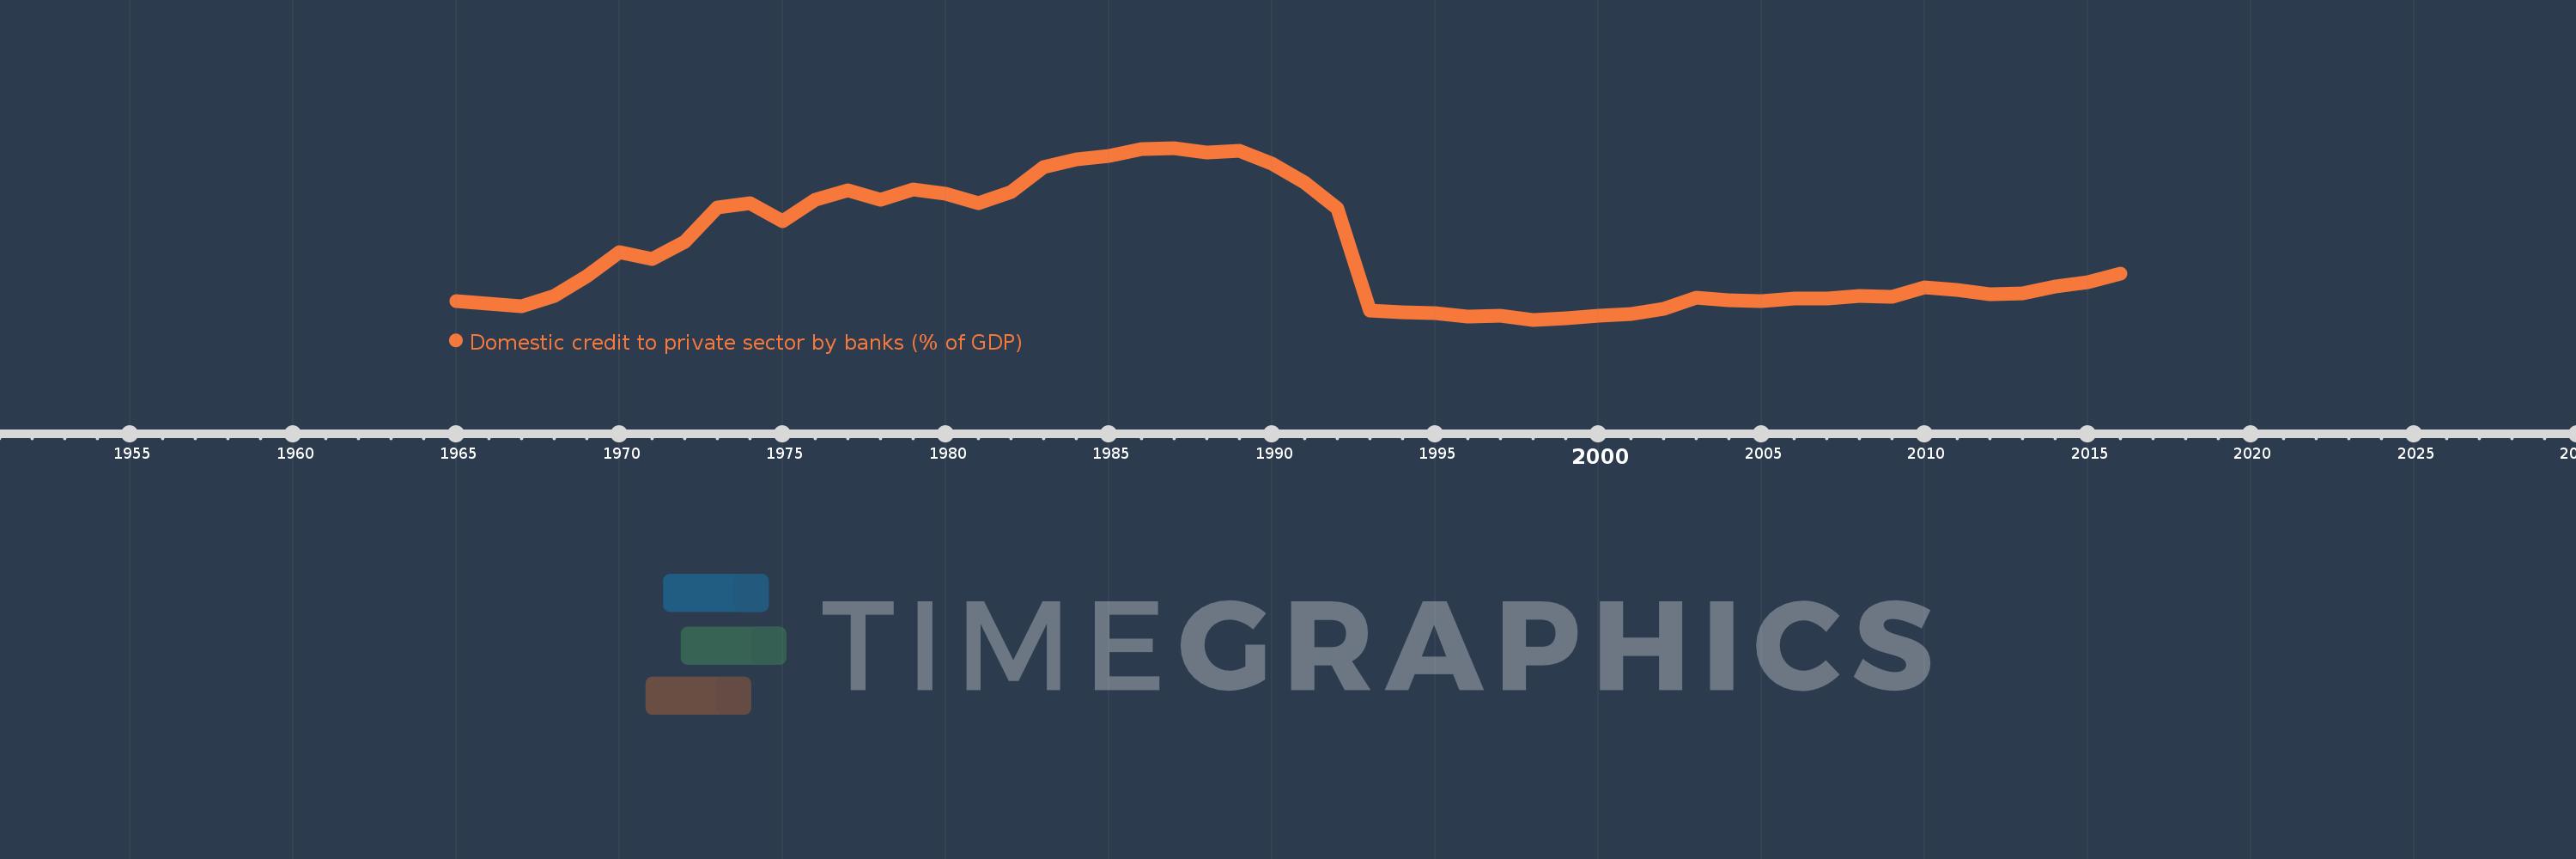
Domestic credit to private sector by banks (% of GDP)
2016,2015,2014,2013,2012,2011,2010,2009,2008,2007,2006,2005,2004,2003,2002,2001,2000,1999,1998,1997,1996,1995,1994,1993,1992,1991,1990,1989,1988,1987,1986,1985,1984,1983,1982,1981,1980,1979,1978,1977,1976,1975,1974,1973,1972,1971,1970,1969,1968,1967,1966,1965
This statistics in other country:
AfghanistanAlbaniaAlgeriaAngolaAntigua and BarbudaArab WorldArgentinaArmeniaArubaAustraliaAustriaAzerbaijanBahamas, TheBahrainBangladeshBarbadosBelarusBelgiumBelizeBeninBhutanBoliviaBosnia and HerzegovinaBotswanaBrazilBrunei DarussalamBulgariaBurkina FasoBurundiCabo VerdeCambodiaCameroonCanadaCaribbean small statesCentral African RepublicCentral Europe and the BalticsChadChileChinaColombiaComorosCongo, Dem. Rep.Congo, Rep.Costa RicaCote d'IvoireCroatiaCyprusCzech RepublicDenmarkDjiboutiDominicaDominican RepublicEarly-demographic dividendEast Asia & PacificEast Asia & Pacific (excluding high income)East Asia & Pacific (IDA & IBRD countries)EcuadorEgypt, Arab Rep.El SalvadorEquatorial GuineaEritreaEstoniaEthiopiaEuro areaEurope & Central AsiaEurope & Central Asia (excluding high income)Europe & Central Asia (IDA & IBRD countries)European UnionFijiFinlandFragile and conflict affected situationsFranceGabonGambia, TheGeorgiaGermanyGhanaGreeceGrenadaGuatemalaGuineaGuinea-BissauGuyanaHaitiHeavily indebted poor countries (HIPC)High incomeHondurasHong Kong SAR, ChinaHungaryIBRD onlyIcelandIDA & IBRD totalIDA blendIDA onlyIDA totalIndiaIndonesiaIran, Islamic Rep.IraqIrelandIsraelItalyJamaicaJapanJordanKazakhstanKenyaKorea, Rep.KosovoKuwaitKyrgyz RepublicLao PDRLate-demographic dividendLatin America & Caribbean Latin America & Caribbean (excluding high income)Latin America & the Caribbean (IDA & IBRD countries)LatviaLeast developed countries: UN classificationLebanonLesothoLiberiaLibyaLithuaniaLow & middle incomeLow incomeLower middle incomeLuxembourgMacao SAR, ChinaMacedonia, FYRMadagascarMalawiMalaysiaMaldivesMaliMaltaMauritaniaMauritiusMexicoMicronesia, Fed. Sts.Middle East & North AfricaMiddle East & North Africa (excluding high income)Middle East & North Africa (IDA & IBRD countries)Middle incomeMoldovaMongoliaMontenegroMoroccoMozambiqueMyanmarNamibiaNepalNetherlandsNew ZealandNicaraguaNigerNigeriaNorth AmericaNorwayOECD membersOmanOther small statesPacific island small statesPakistanPanamaPapua New GuineaParaguayPeruPhilippinesPolandPortugalPost-demographic dividendPre-demographic dividendQatarRomaniaRussian FederationRwandaSamoaSao Tome and PrincipeSaudi ArabiaSenegalSerbiaSeychellesSierra LeoneSingaporeSlovak RepublicSloveniaSmall statesSolomon IslandsSouth AfricaSouth AsiaSouth Asia (IDA & IBRD)South SudanSpainSri LankaSt. Kitts and NevisSt. LuciaSt. Vincent and the GrenadinesSub-Saharan Africa Sub-Saharan Africa (excluding high income)Sub-Saharan Africa (IDA & IBRD countries)SudanSurinameSwazilandSwedenSwitzerlandSyrian Arab RepublicTajikistanTanzaniaThailandTimor-LesteTogoTongaTrinidad and TobagoTunisiaTurkeyUgandaUkraineUnited Arab EmiratesUnited KingdomUnited StatesUpper middle incomeUruguayVanuatuVenezuela, RBVietnamWest Bank and GazaWorldYemen, Rep.ZambiaZimbabwe Timeline:
This timeline shows a graph from 1965 to 2016 of Algeria. No data until 1964. Number of actual observations by date: 52.
Source name:
World Development Indicators
Source organization:
International Monetary Fund, International Financial Statistics and data files, and World Bank and OECD GDP estimates.
Categories, topics:
Financial Sector
Last updated:
apr 23, 2017
Indicators value changes by year
Maximum:
69.284
jan 1, 1987
At the date of observation
Value
Absolute change
Change from previous value
jan 1, 1965
10.896
+10.896
0.0%
jan 1, 1966
10.062
-0.834
-7.65%
jan 1, 1967
8.955
-1.107
-11.0%
jan 1, 1968
13.009
+4.054
45.27%
jan 1, 1969
20.407
+7.398
56.86%
jan 1, 1970
29.693
+9.286
45.51%
jan 1, 1971
27.041
-2.652
-8.93%
jan 1, 1972
33.638
+6.596
24.39%
jan 1, 1973
46.572
+12.935
38.45%
jan 1, 1974
48.158
+1.586
3.41%
jan 1, 1975
41.4
-6.759
-14.03%
jan 1, 1976
49.42
+8.02
19.37%
jan 1, 1977
53.1
+3.68
7.45%
jan 1, 1978
49.519
-3.581
-6.74%
jan 1, 1979
53.502
+3.983
8.04%
jan 1, 1980
51.726
-1.776
-3.32%
jan 1, 1981
48.302
-3.424
-6.62%
jan 1, 1982
52.396
+4.094
8.48%
jan 1, 1983
62.0
+9.604
18.33%
jan 1, 1984
64.924
+2.924
4.72%
jan 1, 1985
66.372
+1.448
2.23%
jan 1, 1986
68.701
+2.329
3.51%
jan 1, 1987
69.284
+0.583
0.85%
jan 1, 1988
67.507
-1.777
-2.57%
jan 1, 1989
68.123
+0.616
0.91%
jan 1, 1990
63.174
-4.949
-7.26%
jan 1, 1991
56.143
-7.031
-11.13%
jan 1, 1992
46.289
-9.854
-17.55%
jan 1, 1993
7.251
-39.038
-84.34%
jan 1, 1994
6.614
-0.637
-8.78%
jan 1, 1995
6.487
-0.127
-1.93%
jan 1, 1996
5.198
-1.289
-19.87%
jan 1, 1997
5.364
+0.166
3.19%
jan 1, 1998
3.905
-1.459
-27.2%
jan 1, 1999
4.552
+0.648
16.59%
jan 1, 2000
5.37
+0.817
17.96%
jan 1, 2001
5.949
+0.579
10.79%
jan 1, 2002
7.978
+2.028
34.1%
jan 1, 2003
12.165
+4.188
52.49%
jan 1, 2004
11.191
-0.974
-8.01%
jan 1, 2005
10.973
-0.218
-1.95%
jan 1, 2006
11.847
+0.874
7.97%
jan 1, 2007
12.097
+0.25
2.11%
jan 1, 2008
12.969
+0.872
7.21%
jan 1, 2009
12.777
-0.192
-1.48%
jan 1, 2010
16.245
+3.468
27.14%
jan 1, 2011
15.191
-1.054
-6.49%
jan 1, 2012
13.698
-1.493
-9.83%
jan 1, 2013
14.01
+0.311
2.27%
jan 1, 2014
16.488
+2.478
17.69%
jan 1, 2015
18.353
+1.865
11.31%
jan 1, 2016
21.57
+3.218
17.53%
Ranking of countries by current statistics by years


Comments: