29
/
en
AIzaSyAYiBZKx7MnpbEhh9jyipgxe19OcubqV5w
April 1, 2024
135395
Gabon
GAB
true
2
1
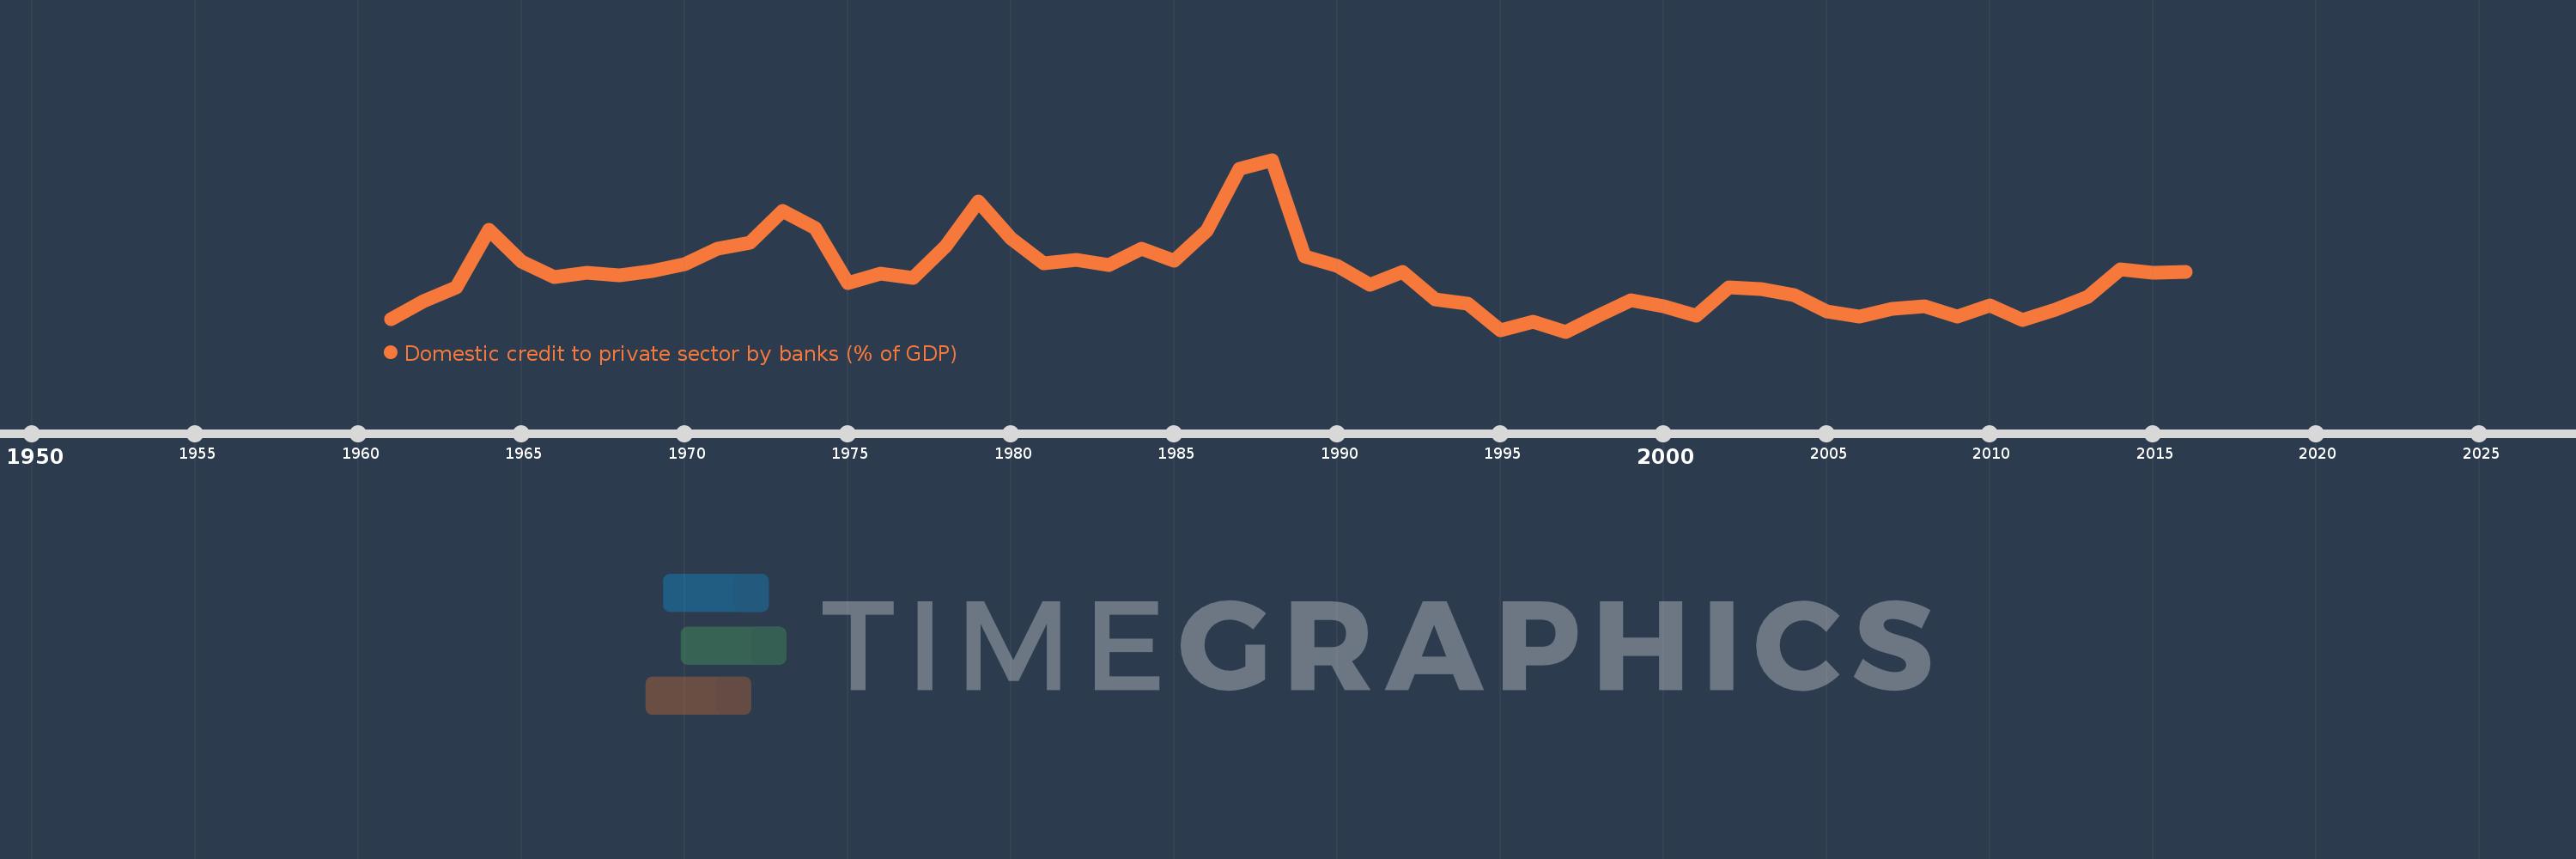
Domestic credit to private sector by banks (% of GDP)
2016,2015,2014,2013,2012,2011,2010,2009,2008,2007,2006,2005,2004,2003,2002,2001,2000,1999,1998,1997,1996,1995,1994,1993,1992,1991,1990,1989,1988,1987,1986,1985,1984,1983,1982,1981,1980,1979,1978,1977,1976,1975,1974,1973,1972,1971,1970,1969,1968,1967,1966,1965,1964,1963,1962,1961
This statistics in other country:
AfghanistanAlbaniaAlgeriaAngolaAntigua and BarbudaArab WorldArgentinaArmeniaArubaAustraliaAustriaAzerbaijanBahamas, TheBahrainBangladeshBarbadosBelarusBelgiumBelizeBeninBhutanBoliviaBosnia and HerzegovinaBotswanaBrazilBrunei DarussalamBulgariaBurkina FasoBurundiCabo VerdeCambodiaCameroonCanadaCaribbean small statesCentral African RepublicCentral Europe and the BalticsChadChileChinaColombiaComorosCongo, Dem. Rep.Congo, Rep.Costa RicaCote d'IvoireCroatiaCyprusCzech RepublicDenmarkDjiboutiDominicaDominican RepublicEarly-demographic dividendEast Asia & PacificEast Asia & Pacific (excluding high income)East Asia & Pacific (IDA & IBRD countries)EcuadorEgypt, Arab Rep.El SalvadorEquatorial GuineaEritreaEstoniaEthiopiaEuro areaEurope & Central AsiaEurope & Central Asia (excluding high income)Europe & Central Asia (IDA & IBRD countries)European UnionFijiFinlandFragile and conflict affected situationsFranceGabonGambia, TheGeorgiaGermanyGhanaGreeceGrenadaGuatemalaGuineaGuinea-BissauGuyanaHaitiHeavily indebted poor countries (HIPC)High incomeHondurasHong Kong SAR, ChinaHungaryIBRD onlyIcelandIDA & IBRD totalIDA blendIDA onlyIDA totalIndiaIndonesiaIran, Islamic Rep.IraqIrelandIsraelItalyJamaicaJapanJordanKazakhstanKenyaKorea, Rep.KosovoKuwaitKyrgyz RepublicLao PDRLate-demographic dividendLatin America & Caribbean Latin America & Caribbean (excluding high income)Latin America & the Caribbean (IDA & IBRD countries)LatviaLeast developed countries: UN classificationLebanonLesothoLiberiaLibyaLithuaniaLow & middle incomeLow incomeLower middle incomeLuxembourgMacao SAR, ChinaMacedonia, FYRMadagascarMalawiMalaysiaMaldivesMaliMaltaMauritaniaMauritiusMexicoMicronesia, Fed. Sts.Middle East & North AfricaMiddle East & North Africa (excluding high income)Middle East & North Africa (IDA & IBRD countries)Middle incomeMoldovaMongoliaMontenegroMoroccoMozambiqueMyanmarNamibiaNepalNetherlandsNew ZealandNicaraguaNigerNigeriaNorth AmericaNorwayOECD membersOmanOther small statesPacific island small statesPakistanPanamaPapua New GuineaParaguayPeruPhilippinesPolandPortugalPost-demographic dividendPre-demographic dividendQatarRomaniaRussian FederationRwandaSamoaSao Tome and PrincipeSaudi ArabiaSenegalSerbiaSeychellesSierra LeoneSingaporeSlovak RepublicSloveniaSmall statesSolomon IslandsSouth AfricaSouth AsiaSouth Asia (IDA & IBRD)South SudanSpainSri LankaSt. Kitts and NevisSt. LuciaSt. Vincent and the GrenadinesSub-Saharan Africa Sub-Saharan Africa (excluding high income)Sub-Saharan Africa (IDA & IBRD countries)SudanSurinameSwazilandSwedenSwitzerlandSyrian Arab RepublicTajikistanTanzaniaThailandTimor-LesteTogoTongaTrinidad and TobagoTunisiaTurkeyUgandaUkraineUnited Arab EmiratesUnited KingdomUnited StatesUpper middle incomeUruguayVanuatuVenezuela, RBVietnamWest Bank and GazaWorldYemen, Rep.ZambiaZimbabwe Timeline:
This timeline shows a graph from 1961 to 2016 of Gabon. No data until 1960. Number of actual observations by date: 56.
Source name:
World Development Indicators
Source organization:
International Monetary Fund, International Financial Statistics and data files, and World Bank and OECD GDP estimates.
Categories, topics:
Financial Sector
Last updated:
apr 23, 2017
Indicators value changes by year
At the date of observation
Value
Absolute change
Change from previous value
jan 1, 1961
8.216
+8.216
0.0%
jan 1, 1962
10.726
+2.51
30.55%
jan 1, 1963
12.57
+1.844
17.2%
jan 1, 1964
20.264
+7.694
61.2%
jan 1, 1965
15.971
-4.294
-21.19%
jan 1, 1966
13.946
-2.025
-12.68%
jan 1, 1967
14.47
+0.524
3.76%
jan 1, 1968
14.192
-0.279
-1.93%
jan 1, 1969
14.746
+0.555
3.91%
jan 1, 1970
15.642
+0.896
6.08%
jan 1, 1971
17.763
+2.121
13.56%
jan 1, 1972
18.545
+0.782
4.4%
jan 1, 1973
22.836
+4.291
23.14%
jan 1, 1974
20.564
-2.272
-9.95%
jan 1, 1975
13.12
-7.444
-36.2%
jan 1, 1976
14.41
+1.29
9.83%
jan 1, 1977
13.871
-0.539
-3.74%
jan 1, 1978
18.069
+4.198
30.27%
jan 1, 1979
24.106
+6.037
33.41%
jan 1, 1980
19.137
-4.97
-20.62%
jan 1, 1981
15.769
-3.367
-17.6%
jan 1, 1982
16.293
+0.523
3.32%
jan 1, 1983
15.559
-0.734
-4.5%
jan 1, 1984
17.729
+2.17
13.95%
jan 1, 1985
16.182
-1.546
-8.72%
jan 1, 1986
20.206
+4.024
24.87%
jan 1, 1987
28.534
+8.328
41.21%
jan 1, 1988
29.74
+1.206
4.23%
jan 1, 1989
16.748
-12.992
-43.68%
jan 1, 1990
15.479
-1.27
-7.58%
jan 1, 1991
12.922
-2.556
-16.52%
jan 1, 1992
14.634
+1.712
13.25%
jan 1, 1993
10.944
-3.69
-25.21%
jan 1, 1994
10.315
-0.629
-5.75%
jan 1, 1995
6.756
-3.559
-34.5%
jan 1, 1996
7.922
+1.166
17.26%
jan 1, 1997
6.589
-1.332
-16.82%
jan 1, 1998
8.681
+2.091
31.74%
jan 1, 1999
10.78
+2.099
24.18%
jan 1, 2000
9.964
-0.816
-7.57%
jan 1, 2001
8.697
-1.267
-12.72%
jan 1, 2002
12.521
+3.825
43.98%
jan 1, 2003
12.311
-0.21
-1.68%
jan 1, 2004
11.518
-0.793
-6.44%
jan 1, 2005
9.271
-2.247
-19.51%
jan 1, 2006
8.571
-0.7
-7.55%
jan 1, 2007
9.708
+1.137
13.26%
jan 1, 2008
9.952
+0.245
2.52%
jan 1, 2009
8.652
-1.301
-13.07%
jan 1, 2010
10.08
+1.429
16.51%
jan 1, 2011
8.193
-1.887
-18.72%
jan 1, 2012
9.51
+1.317
16.07%
jan 1, 2013
11.278
+1.767
18.58%
jan 1, 2014
14.984
+3.707
32.87%
jan 1, 2015
14.513
-0.471
-3.15%
jan 1, 2016
14.602
+0.089
0.61%
Ranking of countries by current statistics by years


Comments: