29
/
en
AIzaSyAYiBZKx7MnpbEhh9jyipgxe19OcubqV5w
April 1, 2024
245432
South Africa
ZAF
true
2
1
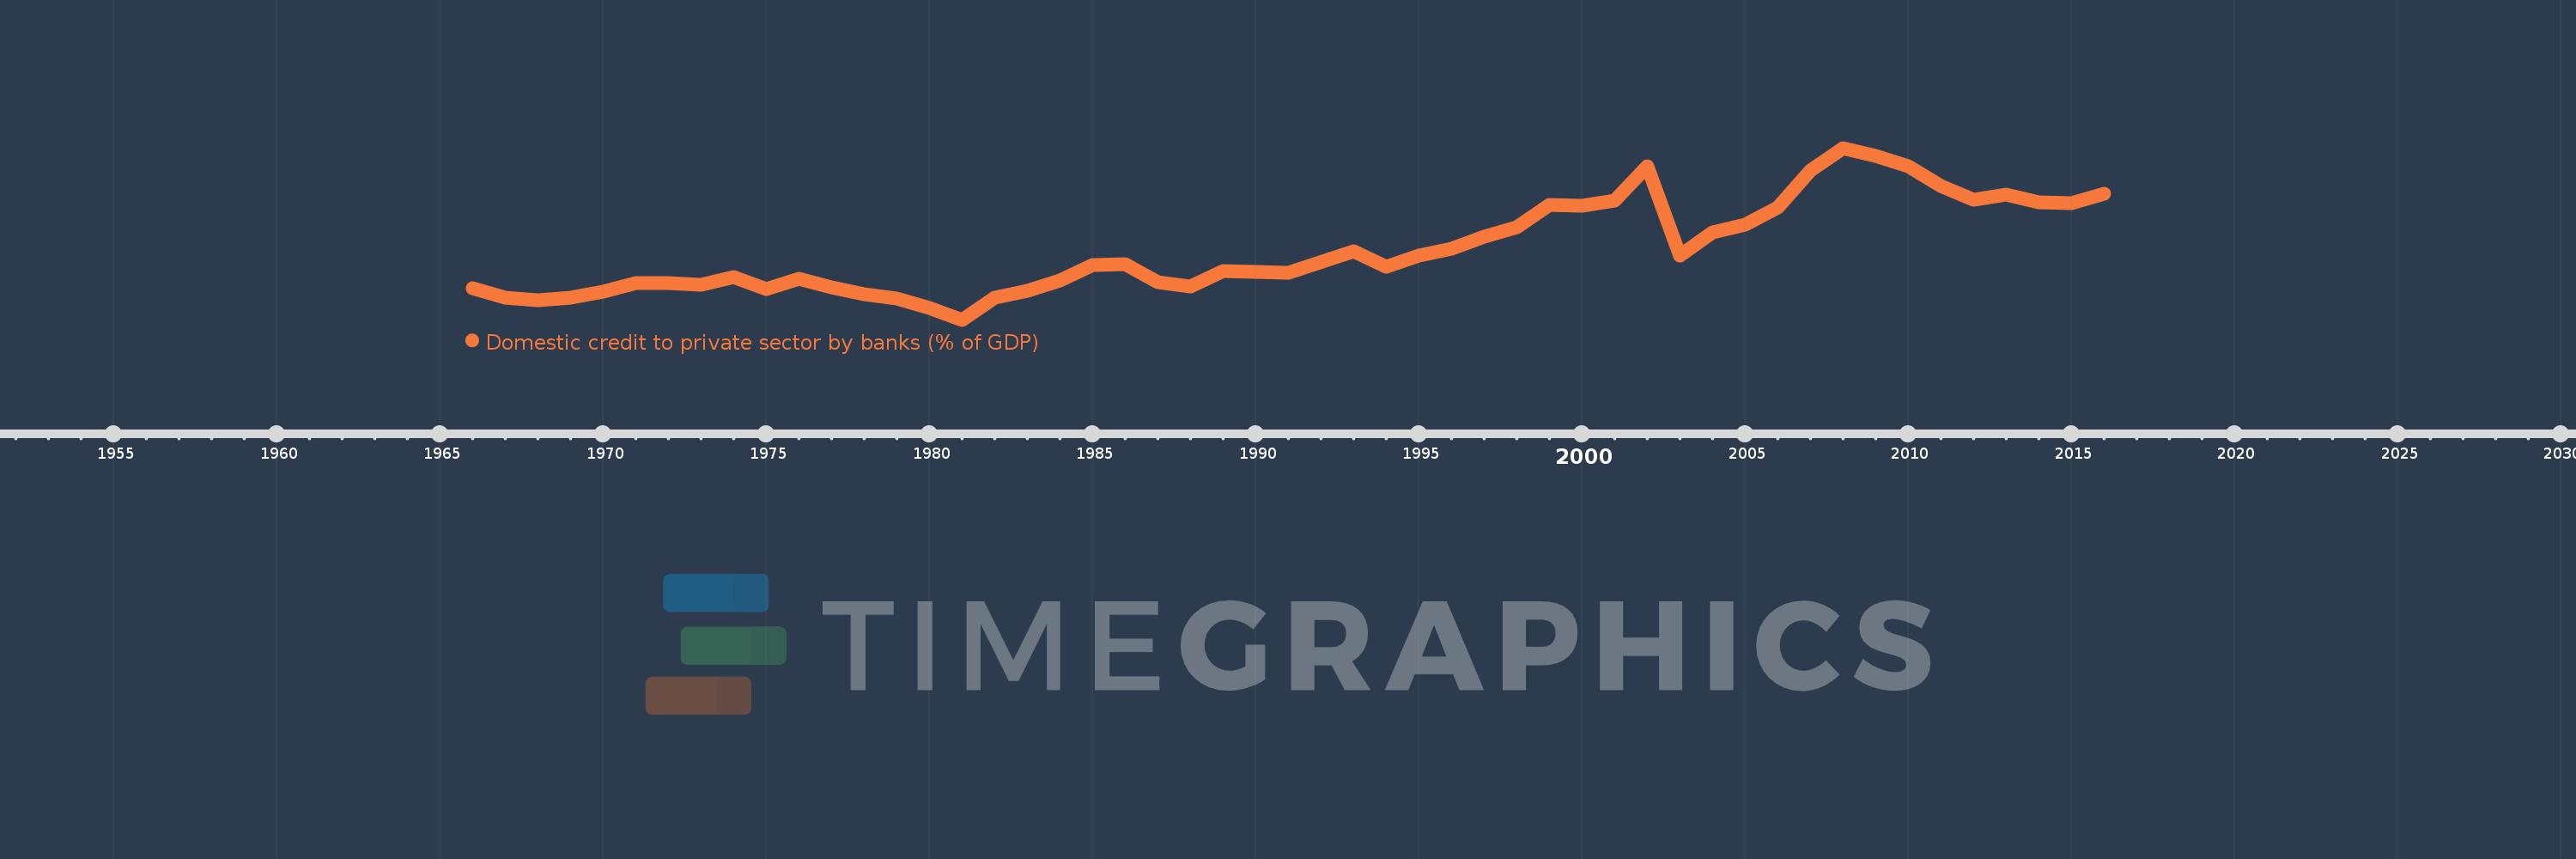
Domestic credit to private sector by banks (% of GDP)
2016,2015,2014,2013,2012,2011,2010,2009,2008,2007,2006,2005,2004,2003,2002,2001,2000,1999,1998,1997,1996,1995,1994,1993,1991,1990,1989,1988,1987,1986,1985,1984,1983,1982,1981,1980,1979,1978,1977,1976,1975,1974,1973,1972,1971,1970,1969,1968,1967,1966
This statistics in other country:
AfghanistanAlbaniaAlgeriaAngolaAntigua and BarbudaArab WorldArgentinaArmeniaArubaAustraliaAustriaAzerbaijanBahamas, TheBahrainBangladeshBarbadosBelarusBelgiumBelizeBeninBhutanBoliviaBosnia and HerzegovinaBotswanaBrazilBrunei DarussalamBulgariaBurkina FasoBurundiCabo VerdeCambodiaCameroonCanadaCaribbean small statesCentral African RepublicCentral Europe and the BalticsChadChileChinaColombiaComorosCongo, Dem. Rep.Congo, Rep.Costa RicaCote d'IvoireCroatiaCyprusCzech RepublicDenmarkDjiboutiDominicaDominican RepublicEarly-demographic dividendEast Asia & PacificEast Asia & Pacific (excluding high income)East Asia & Pacific (IDA & IBRD countries)EcuadorEgypt, Arab Rep.El SalvadorEquatorial GuineaEritreaEstoniaEthiopiaEuro areaEurope & Central AsiaEurope & Central Asia (excluding high income)Europe & Central Asia (IDA & IBRD countries)European UnionFijiFinlandFragile and conflict affected situationsFranceGabonGambia, TheGeorgiaGermanyGhanaGreeceGrenadaGuatemalaGuineaGuinea-BissauGuyanaHaitiHeavily indebted poor countries (HIPC)High incomeHondurasHong Kong SAR, ChinaHungaryIBRD onlyIcelandIDA & IBRD totalIDA blendIDA onlyIDA totalIndiaIndonesiaIran, Islamic Rep.IraqIrelandIsraelItalyJamaicaJapanJordanKazakhstanKenyaKorea, Rep.KosovoKuwaitKyrgyz RepublicLao PDRLate-demographic dividendLatin America & Caribbean Latin America & Caribbean (excluding high income)Latin America & the Caribbean (IDA & IBRD countries)LatviaLeast developed countries: UN classificationLebanonLesothoLiberiaLibyaLithuaniaLow & middle incomeLow incomeLower middle incomeLuxembourgMacao SAR, ChinaMacedonia, FYRMadagascarMalawiMalaysiaMaldivesMaliMaltaMauritaniaMauritiusMexicoMicronesia, Fed. Sts.Middle East & North AfricaMiddle East & North Africa (excluding high income)Middle East & North Africa (IDA & IBRD countries)Middle incomeMoldovaMongoliaMontenegroMoroccoMozambiqueMyanmarNamibiaNepalNetherlandsNew ZealandNicaraguaNigerNigeriaNorth AmericaNorwayOECD membersOmanOther small statesPacific island small statesPakistanPanamaPapua New GuineaParaguayPeruPhilippinesPolandPortugalPost-demographic dividendPre-demographic dividendQatarRomaniaRussian FederationRwandaSamoaSao Tome and PrincipeSaudi ArabiaSenegalSerbiaSeychellesSierra LeoneSingaporeSlovak RepublicSloveniaSmall statesSolomon IslandsSouth AfricaSouth AsiaSouth Asia (IDA & IBRD)South SudanSpainSri LankaSt. Kitts and NevisSt. LuciaSt. Vincent and the GrenadinesSub-Saharan Africa Sub-Saharan Africa (excluding high income)Sub-Saharan Africa (IDA & IBRD countries)SudanSurinameSwazilandSwedenSwitzerlandSyrian Arab RepublicTajikistanTanzaniaThailandTimor-LesteTogoTongaTrinidad and TobagoTunisiaTurkeyUgandaUkraineUnited Arab EmiratesUnited KingdomUnited StatesUpper middle incomeUruguayVanuatuVenezuela, RBVietnamWest Bank and GazaWorldYemen, Rep.ZambiaZimbabwe Timeline:
This timeline shows a graph from 1966 to 2016 of South Africa. No data until 1965. Number of actual observations by date: 50.
Source name:
World Development Indicators
Source organization:
International Monetary Fund, International Financial Statistics and data files, and World Bank and OECD GDP estimates.
Categories, topics:
Financial Sector
Last updated:
apr 23, 2017
Indicators value changes by year
Minimum:
42.758
jan 1, 1981
Maximum:
78.294
jan 1, 2008
At the date of observation
Value
Absolute change
Change from previous value
jan 1, 1966
49.321
+49.321
0.0%
jan 1, 1967
47.398
-1.923
-3.9%
jan 1, 1968
46.722
-0.675
-1.42%
jan 1, 1969
47.411
+0.689
1.47%
jan 1, 1970
48.499
+1.088
2.3%
jan 1, 1971
50.294
+1.794
3.7%
jan 1, 1972
50.274
-0.02
-0.04%
jan 1, 1973
49.95
-0.324
-0.64%
jan 1, 1974
51.517
+1.567
3.14%
jan 1, 1975
49.022
-2.495
-4.84%
jan 1, 1976
51.307
+2.284
4.66%
jan 1, 1977
49.5
-1.807
-3.52%
jan 1, 1978
48.034
-1.466
-2.96%
jan 1, 1979
47.074
-0.961
-2.0%
jan 1, 1980
45.275
-1.798
-3.82%
jan 1, 1981
42.758
-2.517
-5.56%
jan 1, 1982
47.35
+4.592
10.74%
jan 1, 1983
48.744
+1.394
2.94%
jan 1, 1984
50.902
+2.158
4.43%
jan 1, 1985
54.089
+3.187
6.26%
jan 1, 1986
54.169
+0.08
0.15%
jan 1, 1987
50.493
-3.676
-6.79%
jan 1, 1988
49.667
-0.825
-1.63%
jan 1, 1989
52.756
+3.089
6.22%
jan 1, 1990
52.575
-0.181
-0.34%
jan 1, 1991
52.405
-0.17
-0.32%
jan 1, 1993
56.923
+4.518
8.62%
jan 1, 1994
53.669
-3.254
-5.72%
jan 1, 1995
56.038
+2.369
4.41%
jan 1, 1996
57.48
+1.442
2.57%
jan 1, 1997
59.957
+2.477
4.31%
jan 1, 1998
61.851
+1.894
3.16%
jan 1, 1999
66.452
+4.601
7.44%
jan 1, 2000
66.266
-0.186
-0.28%
jan 1, 2001
67.336
+1.069
1.61%
jan 1, 2002
74.433
+7.097
10.54%
jan 1, 2003
56.03
-18.402
-24.72%
jan 1, 2004
60.772
+4.742
8.46%
jan 1, 2005
62.505
+1.733
2.85%
jan 1, 2006
65.902
+3.397
5.44%
jan 1, 2007
73.624
+7.722
11.72%
jan 1, 2008
78.294
+4.67
6.34%
jan 1, 2009
76.687
-1.607
-2.05%
jan 1, 2010
74.596
-2.09
-2.73%
jan 1, 2011
70.352
-4.245
-5.69%
jan 1, 2012
67.585
-2.766
-3.93%
jan 1, 2013
68.626
+1.041
1.54%
jan 1, 2014
67.097
-1.529
-2.23%
jan 1, 2015
66.932
-0.165
-0.25%
jan 1, 2016
68.856
+1.924
2.87%
Ranking of countries by current statistics by years


Comments: