29
/
en
AIzaSyAYiBZKx7MnpbEhh9jyipgxe19OcubqV5w
April 1, 2024
100970
Canada
CAN
true
2
1
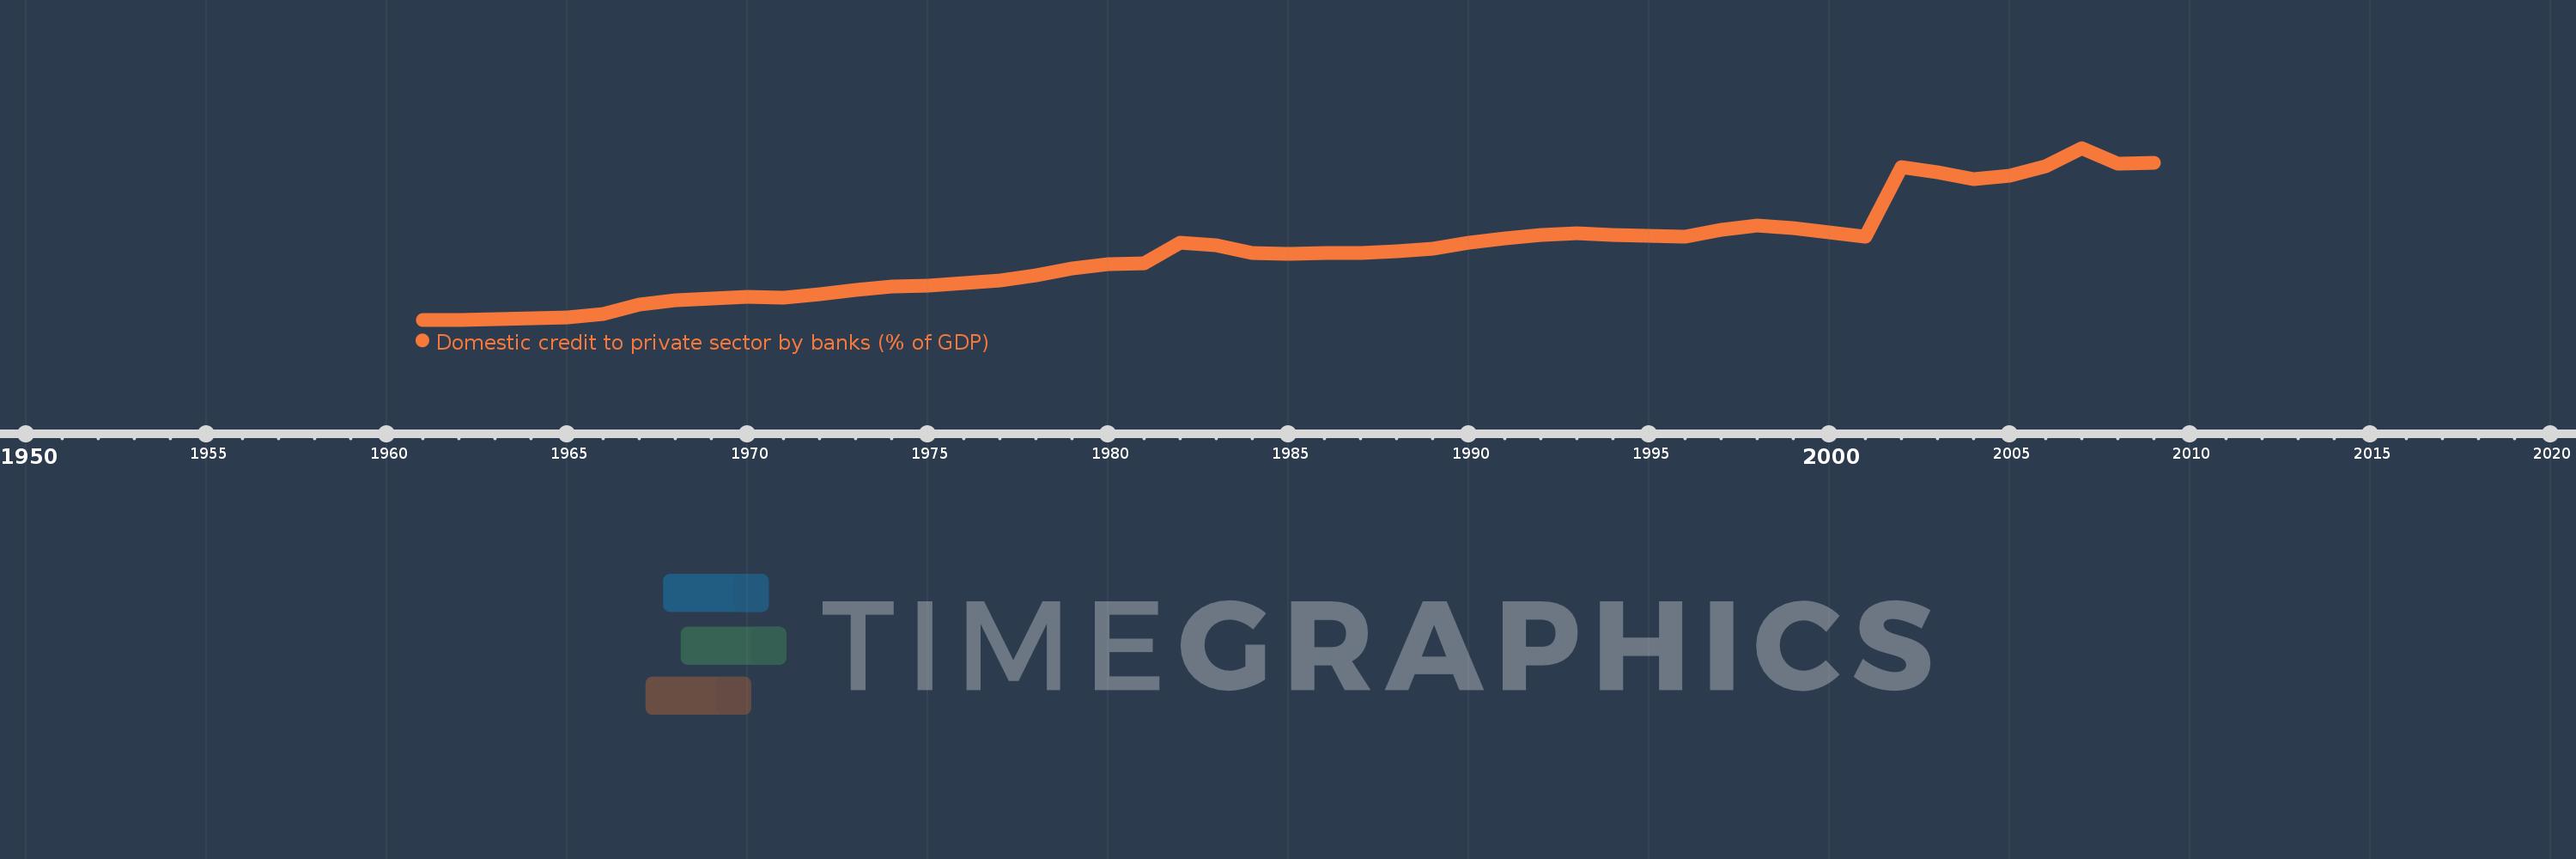
Domestic credit to private sector by banks (% of GDP)
2009,2008,2007,2006,2005,2004,2003,2002,2001,2000,1999,1998,1997,1996,1995,1994,1993,1992,1991,1990,1989,1988,1987,1986,1985,1984,1983,1982,1981,1980,1979,1978,1977,1976,1975,1974,1973,1972,1971,1970,1969,1968,1967,1966,1965,1964,1963,1962,1961
This statistics in other country:
AfghanistanAlbaniaAlgeriaAngolaAntigua and BarbudaArab WorldArgentinaArmeniaArubaAustraliaAustriaAzerbaijanBahamas, TheBahrainBangladeshBarbadosBelarusBelgiumBelizeBeninBhutanBoliviaBosnia and HerzegovinaBotswanaBrazilBrunei DarussalamBulgariaBurkina FasoBurundiCabo VerdeCambodiaCameroonCanadaCaribbean small statesCentral African RepublicCentral Europe and the BalticsChadChileChinaColombiaComorosCongo, Dem. Rep.Congo, Rep.Costa RicaCote d'IvoireCroatiaCyprusCzech RepublicDenmarkDjiboutiDominicaDominican RepublicEarly-demographic dividendEast Asia & PacificEast Asia & Pacific (excluding high income)East Asia & Pacific (IDA & IBRD countries)EcuadorEgypt, Arab Rep.El SalvadorEquatorial GuineaEritreaEstoniaEthiopiaEuro areaEurope & Central AsiaEurope & Central Asia (excluding high income)Europe & Central Asia (IDA & IBRD countries)European UnionFijiFinlandFragile and conflict affected situationsFranceGabonGambia, TheGeorgiaGermanyGhanaGreeceGrenadaGuatemalaGuineaGuinea-BissauGuyanaHaitiHeavily indebted poor countries (HIPC)High incomeHondurasHong Kong SAR, ChinaHungaryIBRD onlyIcelandIDA & IBRD totalIDA blendIDA onlyIDA totalIndiaIndonesiaIran, Islamic Rep.IraqIrelandIsraelItalyJamaicaJapanJordanKazakhstanKenyaKorea, Rep.KosovoKuwaitKyrgyz RepublicLao PDRLate-demographic dividendLatin America & Caribbean Latin America & Caribbean (excluding high income)Latin America & the Caribbean (IDA & IBRD countries)LatviaLeast developed countries: UN classificationLebanonLesothoLiberiaLibyaLithuaniaLow & middle incomeLow incomeLower middle incomeLuxembourgMacao SAR, ChinaMacedonia, FYRMadagascarMalawiMalaysiaMaldivesMaliMaltaMauritaniaMauritiusMexicoMicronesia, Fed. Sts.Middle East & North AfricaMiddle East & North Africa (excluding high income)Middle East & North Africa (IDA & IBRD countries)Middle incomeMoldovaMongoliaMontenegroMoroccoMozambiqueMyanmarNamibiaNepalNetherlandsNew ZealandNicaraguaNigerNigeriaNorth AmericaNorwayOECD membersOmanOther small statesPacific island small statesPakistanPanamaPapua New GuineaParaguayPeruPhilippinesPolandPortugalPost-demographic dividendPre-demographic dividendQatarRomaniaRussian FederationRwandaSamoaSao Tome and PrincipeSaudi ArabiaSenegalSerbiaSeychellesSierra LeoneSingaporeSlovak RepublicSloveniaSmall statesSolomon IslandsSouth AfricaSouth AsiaSouth Asia (IDA & IBRD)South SudanSpainSri LankaSt. Kitts and NevisSt. LuciaSt. Vincent and the GrenadinesSub-Saharan Africa Sub-Saharan Africa (excluding high income)Sub-Saharan Africa (IDA & IBRD countries)SudanSurinameSwazilandSwedenSwitzerlandSyrian Arab RepublicTajikistanTanzaniaThailandTimor-LesteTogoTongaTrinidad and TobagoTunisiaTurkeyUgandaUkraineUnited Arab EmiratesUnited KingdomUnited StatesUpper middle incomeUruguayVanuatuVenezuela, RBVietnamWest Bank and GazaWorldYemen, Rep.ZambiaZimbabwe Timeline:
This timeline shows a graph from 1961 to 2009 of Canada. No data until 1960. Number of actual observations by date: 49.
Source name:
World Development Indicators
Source organization:
International Monetary Fund, International Financial Statistics and data files, and World Bank and OECD GDP estimates.
Categories, topics:
Financial Sector
Last updated:
apr 23, 2017
Indicators value changes by year
Minimum:
18.037
jan 1, 1961
Maximum:
134.513
jan 1, 2007
At the date of observation
Value
Absolute change
Change from previous value
jan 1, 1961
18.037
+18.037
0.0%
jan 1, 1962
18.089
+0.052
0.29%
jan 1, 1963
18.567
+0.477
2.64%
jan 1, 1964
18.946
+0.379
2.04%
jan 1, 1965
19.82
+0.874
4.61%
jan 1, 1966
22.045
+2.225
11.23%
jan 1, 1967
28.375
+6.33
28.72%
jan 1, 1968
31.116
+2.741
9.66%
jan 1, 1969
32.402
+1.286
4.13%
jan 1, 1970
33.78
+1.377
4.25%
jan 1, 1971
32.992
-0.787
-2.33%
jan 1, 1972
35.295
+2.302
6.98%
jan 1, 1973
38.51
+3.215
9.11%
jan 1, 1974
40.437
+1.927
5.0%
jan 1, 1975
41.293
+0.856
2.12%
jan 1, 1976
42.723
+1.43
3.46%
jan 1, 1977
44.71
+1.987
4.65%
jan 1, 1978
48.05
+3.341
7.47%
jan 1, 1979
53.004
+4.954
10.31%
jan 1, 1980
55.743
+2.739
5.17%
jan 1, 1981
56.553
+0.811
1.45%
jan 1, 1982
70.106
+13.552
23.96%
jan 1, 1983
68.312
-1.794
-2.56%
jan 1, 1984
63.251
-5.06
-7.41%
jan 1, 1985
62.856
-0.395
-0.63%
jan 1, 1986
63.476
+0.62
0.99%
jan 1, 1987
63.568
+0.092
0.14%
jan 1, 1988
64.357
+0.789
1.24%
jan 1, 1989
66.485
+2.128
3.31%
jan 1, 1990
70.067
+3.582
5.39%
jan 1, 1991
73.332
+3.265
4.66%
jan 1, 1992
75.259
+1.927
2.63%
jan 1, 1993
76.787
+1.528
2.03%
jan 1, 1994
75.778
-1.009
-1.31%
jan 1, 1995
74.985
-0.794
-1.05%
jan 1, 1996
74.187
-0.798
-1.06%
jan 1, 1997
78.891
+4.704
6.34%
jan 1, 1998
81.801
+2.91
3.69%
jan 1, 1999
80.139
-1.662
-2.03%
jan 1, 2000
77.516
-2.623
-3.27%
jan 1, 2001
74.235
-3.281
-4.23%
jan 1, 2002
121.782
+47.547
64.05%
jan 1, 2003
118.259
-3.523
-2.89%
jan 1, 2004
113.642
-4.617
-3.9%
jan 1, 2005
115.838
+2.196
1.93%
jan 1, 2006
122.051
+6.214
5.36%
jan 1, 2007
134.513
+12.462
10.21%
jan 1, 2008
123.858
-10.656
-7.92%
jan 1, 2009
124.407
+0.549
0.44%
Ranking of countries by current statistics by years


Comments: