29
/
en
AIzaSyAYiBZKx7MnpbEhh9jyipgxe19OcubqV5w
April 1, 2024
38895
IDA only
IDX
false
2
1
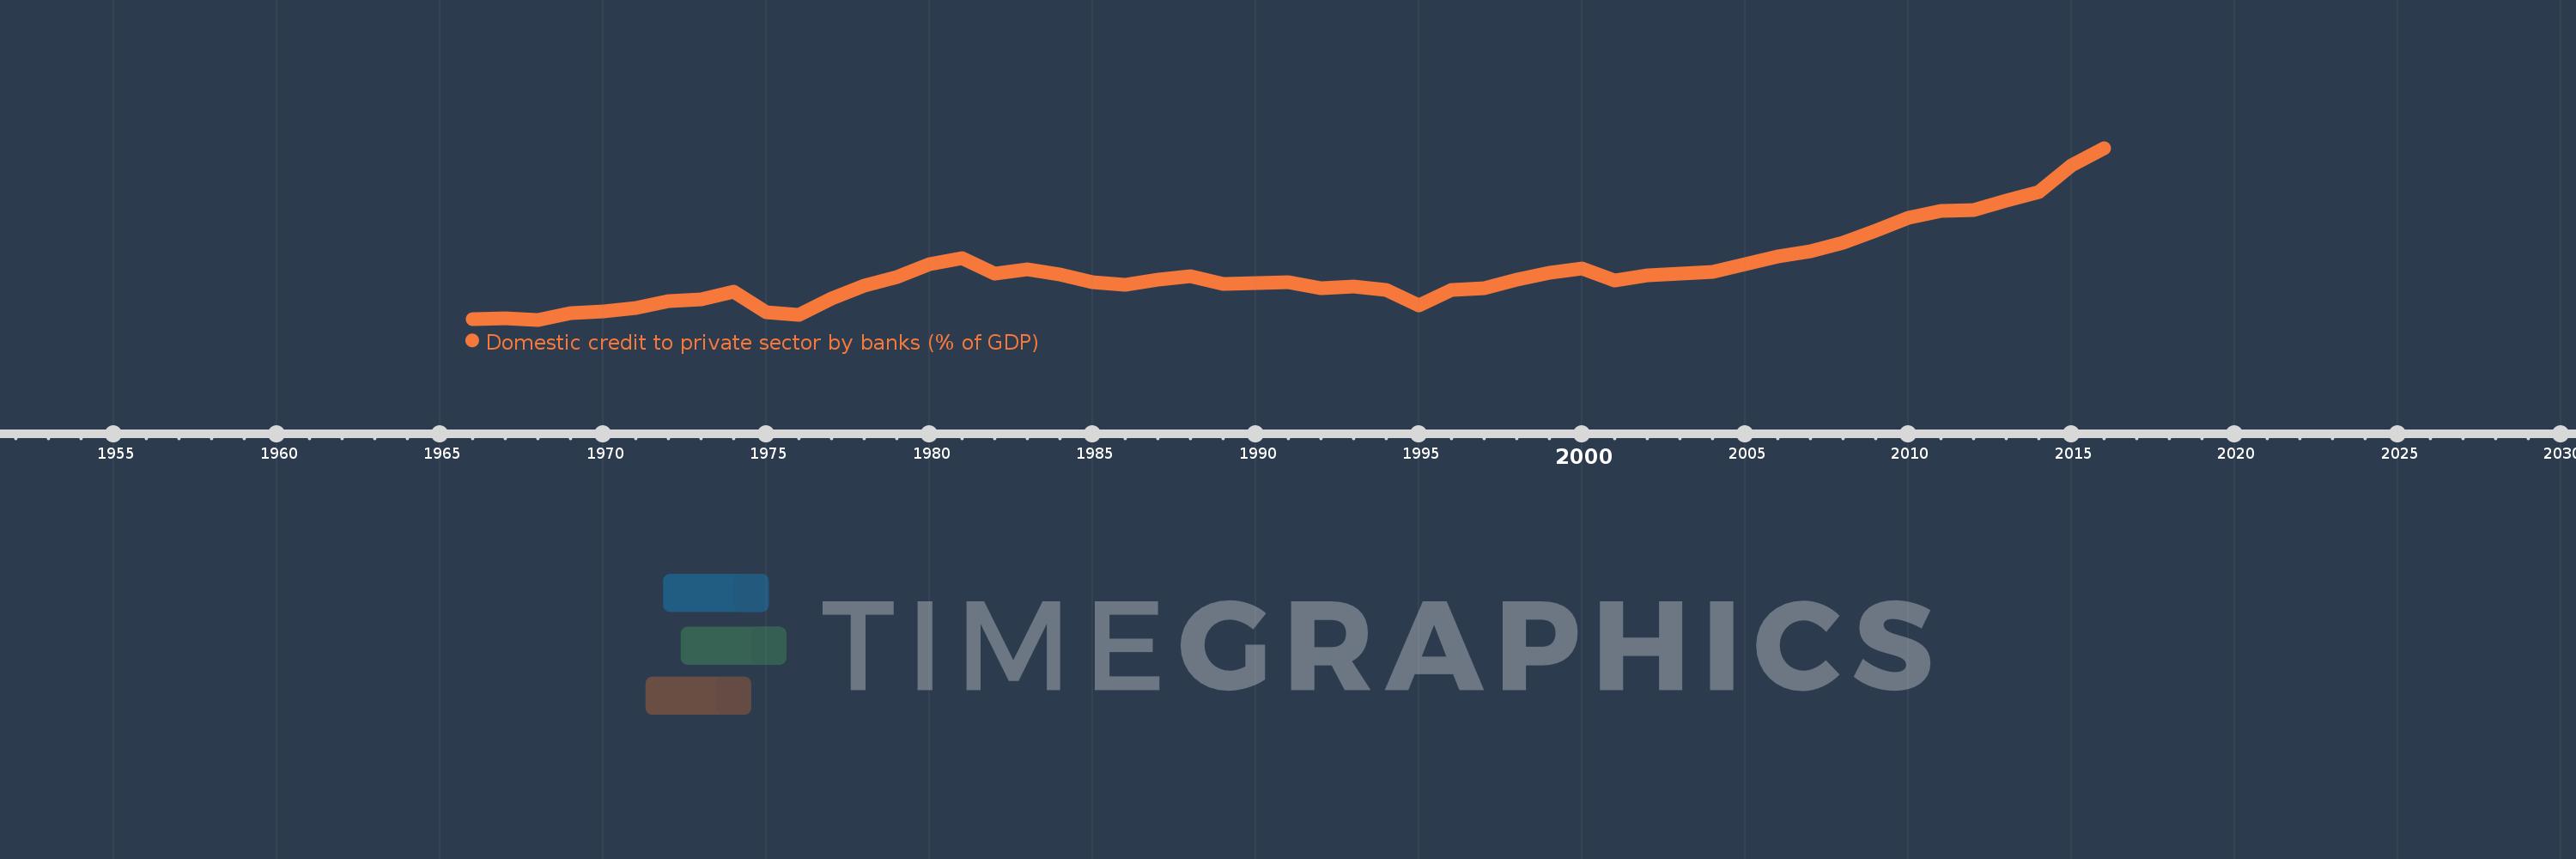
Domestic credit to private sector by banks (% of GDP)
2016,2015,2014,2013,2012,2011,2010,2009,2008,2007,2006,2005,2004,2003,2002,2001,2000,1999,1998,1997,1996,1995,1994,1993,1992,1991,1990,1989,1988,1987,1986,1985,1984,1983,1982,1981,1980,1979,1978,1977,1976,1975,1974,1973,1972,1971,1970,1969,1968,1967,1966
This statistics in other country:
AfghanistanAlbaniaAlgeriaAngolaAntigua and BarbudaArab WorldArgentinaArmeniaArubaAustraliaAustriaAzerbaijanBahamas, TheBahrainBangladeshBarbadosBelarusBelgiumBelizeBeninBhutanBoliviaBosnia and HerzegovinaBotswanaBrazilBrunei DarussalamBulgariaBurkina FasoBurundiCabo VerdeCambodiaCameroonCanadaCaribbean small statesCentral African RepublicCentral Europe and the BalticsChadChileChinaColombiaComorosCongo, Dem. Rep.Congo, Rep.Costa RicaCote d'IvoireCroatiaCyprusCzech RepublicDenmarkDjiboutiDominicaDominican RepublicEarly-demographic dividendEast Asia & PacificEast Asia & Pacific (excluding high income)East Asia & Pacific (IDA & IBRD countries)EcuadorEgypt, Arab Rep.El SalvadorEquatorial GuineaEritreaEstoniaEthiopiaEuro areaEurope & Central AsiaEurope & Central Asia (excluding high income)Europe & Central Asia (IDA & IBRD countries)European UnionFijiFinlandFragile and conflict affected situationsFranceGabonGambia, TheGeorgiaGermanyGhanaGreeceGrenadaGuatemalaGuineaGuinea-BissauGuyanaHaitiHeavily indebted poor countries (HIPC)High incomeHondurasHong Kong SAR, ChinaHungaryIBRD onlyIcelandIDA & IBRD totalIDA blendIDA onlyIDA totalIndiaIndonesiaIran, Islamic Rep.IraqIrelandIsraelItalyJamaicaJapanJordanKazakhstanKenyaKorea, Rep.KosovoKuwaitKyrgyz RepublicLao PDRLate-demographic dividendLatin America & Caribbean Latin America & Caribbean (excluding high income)Latin America & the Caribbean (IDA & IBRD countries)LatviaLeast developed countries: UN classificationLebanonLesothoLiberiaLibyaLithuaniaLow & middle incomeLow incomeLower middle incomeLuxembourgMacao SAR, ChinaMacedonia, FYRMadagascarMalawiMalaysiaMaldivesMaliMaltaMauritaniaMauritiusMexicoMicronesia, Fed. Sts.Middle East & North AfricaMiddle East & North Africa (excluding high income)Middle East & North Africa (IDA & IBRD countries)Middle incomeMoldovaMongoliaMontenegroMoroccoMozambiqueMyanmarNamibiaNepalNetherlandsNew ZealandNicaraguaNigerNigeriaNorth AmericaNorwayOECD membersOmanOther small statesPacific island small statesPakistanPanamaPapua New GuineaParaguayPeruPhilippinesPolandPortugalPost-demographic dividendPre-demographic dividendQatarRomaniaRussian FederationRwandaSamoaSao Tome and PrincipeSaudi ArabiaSenegalSerbiaSeychellesSierra LeoneSingaporeSlovak RepublicSloveniaSmall statesSolomon IslandsSouth AfricaSouth AsiaSouth Asia (IDA & IBRD)South SudanSpainSri LankaSt. Kitts and NevisSt. LuciaSt. Vincent and the GrenadinesSub-Saharan Africa Sub-Saharan Africa (excluding high income)Sub-Saharan Africa (IDA & IBRD countries)SudanSurinameSwazilandSwedenSwitzerlandSyrian Arab RepublicTajikistanTanzaniaThailandTimor-LesteTogoTongaTrinidad and TobagoTunisiaTurkeyUgandaUkraineUnited Arab EmiratesUnited KingdomUnited StatesUpper middle incomeUruguayVanuatuVenezuela, RBVietnamWest Bank and GazaWorldYemen, Rep.ZambiaZimbabwe Timeline:
This timeline shows a graph from 1966 to 2016 of IDA only. No data until 1965. Number of actual observations by date: 51.
Source name:
World Development Indicators
Source organization:
International Monetary Fund, International Financial Statistics and data files, and World Bank and OECD GDP estimates.
Categories, topics:
Financial Sector
Last updated:
apr 23, 2017
Indicators value changes by year
Maximum:
26.771
jan 1, 2016
At the date of observation
Value
Absolute change
Change from previous value
jan 1, 1966
9.889
+9.889
0.0%
jan 1, 1967
10.007
+0.118
1.19%
jan 1, 1968
9.834
-0.173
-1.73%
jan 1, 1969
10.462
+0.628
6.39%
jan 1, 1970
10.616
+0.154
1.47%
jan 1, 1971
10.969
+0.353
3.33%
jan 1, 1972
11.651
+0.682
6.21%
jan 1, 1973
11.866
+0.216
1.85%
jan 1, 1974
12.586
+0.72
6.06%
jan 1, 1975
10.612
-1.973
-15.68%
jan 1, 1976
10.329
-0.283
-2.67%
jan 1, 1977
11.89
+1.561
15.11%
jan 1, 1978
13.166
+1.276
10.73%
jan 1, 1979
14.022
+0.856
6.5%
jan 1, 1980
15.319
+1.297
9.25%
jan 1, 1981
15.883
+0.564
3.68%
jan 1, 1982
14.419
-1.464
-9.22%
jan 1, 1983
14.826
+0.407
2.82%
jan 1, 1984
14.265
-0.561
-3.78%
jan 1, 1985
13.542
-0.723
-5.07%
jan 1, 1986
13.321
-0.221
-1.63%
jan 1, 1987
13.825
+0.504
3.79%
jan 1, 1988
14.124
+0.299
2.16%
jan 1, 1989
13.405
-0.719
-5.09%
jan 1, 1990
13.457
+0.052
0.39%
jan 1, 1991
13.516
+0.059
0.44%
jan 1, 1992
12.911
-0.605
-4.47%
jan 1, 1993
13.132
+0.221
1.71%
jan 1, 1994
12.801
-0.33
-2.51%
jan 1, 1995
11.288
-1.513
-11.82%
jan 1, 1996
12.754
+1.466
12.98%
jan 1, 1997
12.939
+0.185
1.45%
jan 1, 1998
13.78
+0.841
6.5%
jan 1, 1999
14.48
+0.7
5.08%
jan 1, 2000
14.876
+0.396
2.73%
jan 1, 2001
13.738
-1.138
-7.65%
jan 1, 2002
14.242
+0.504
3.67%
jan 1, 2003
14.408
+0.166
1.16%
jan 1, 2004
14.534
+0.127
0.88%
jan 1, 2005
15.314
+0.78
5.37%
jan 1, 2006
16.104
+0.789
5.15%
jan 1, 2007
16.587
+0.483
3.0%
jan 1, 2008
17.411
+0.824
4.97%
jan 1, 2009
18.658
+1.247
7.16%
jan 1, 2010
19.869
+1.211
6.49%
jan 1, 2011
20.559
+0.69
3.47%
jan 1, 2012
20.619
+0.06
0.29%
jan 1, 2013
21.58
+0.961
4.66%
jan 1, 2014
22.451
+0.871
4.04%
jan 1, 2015
25.015
+2.564
11.42%
jan 1, 2016
26.771
+1.755
7.02%
Ranking of countries by current statistics by years


Comments: