29
/
en
AIzaSyAYiBZKx7MnpbEhh9jyipgxe19OcubqV5w
April 1, 2024
84712
Benin
BEN
true
2
1
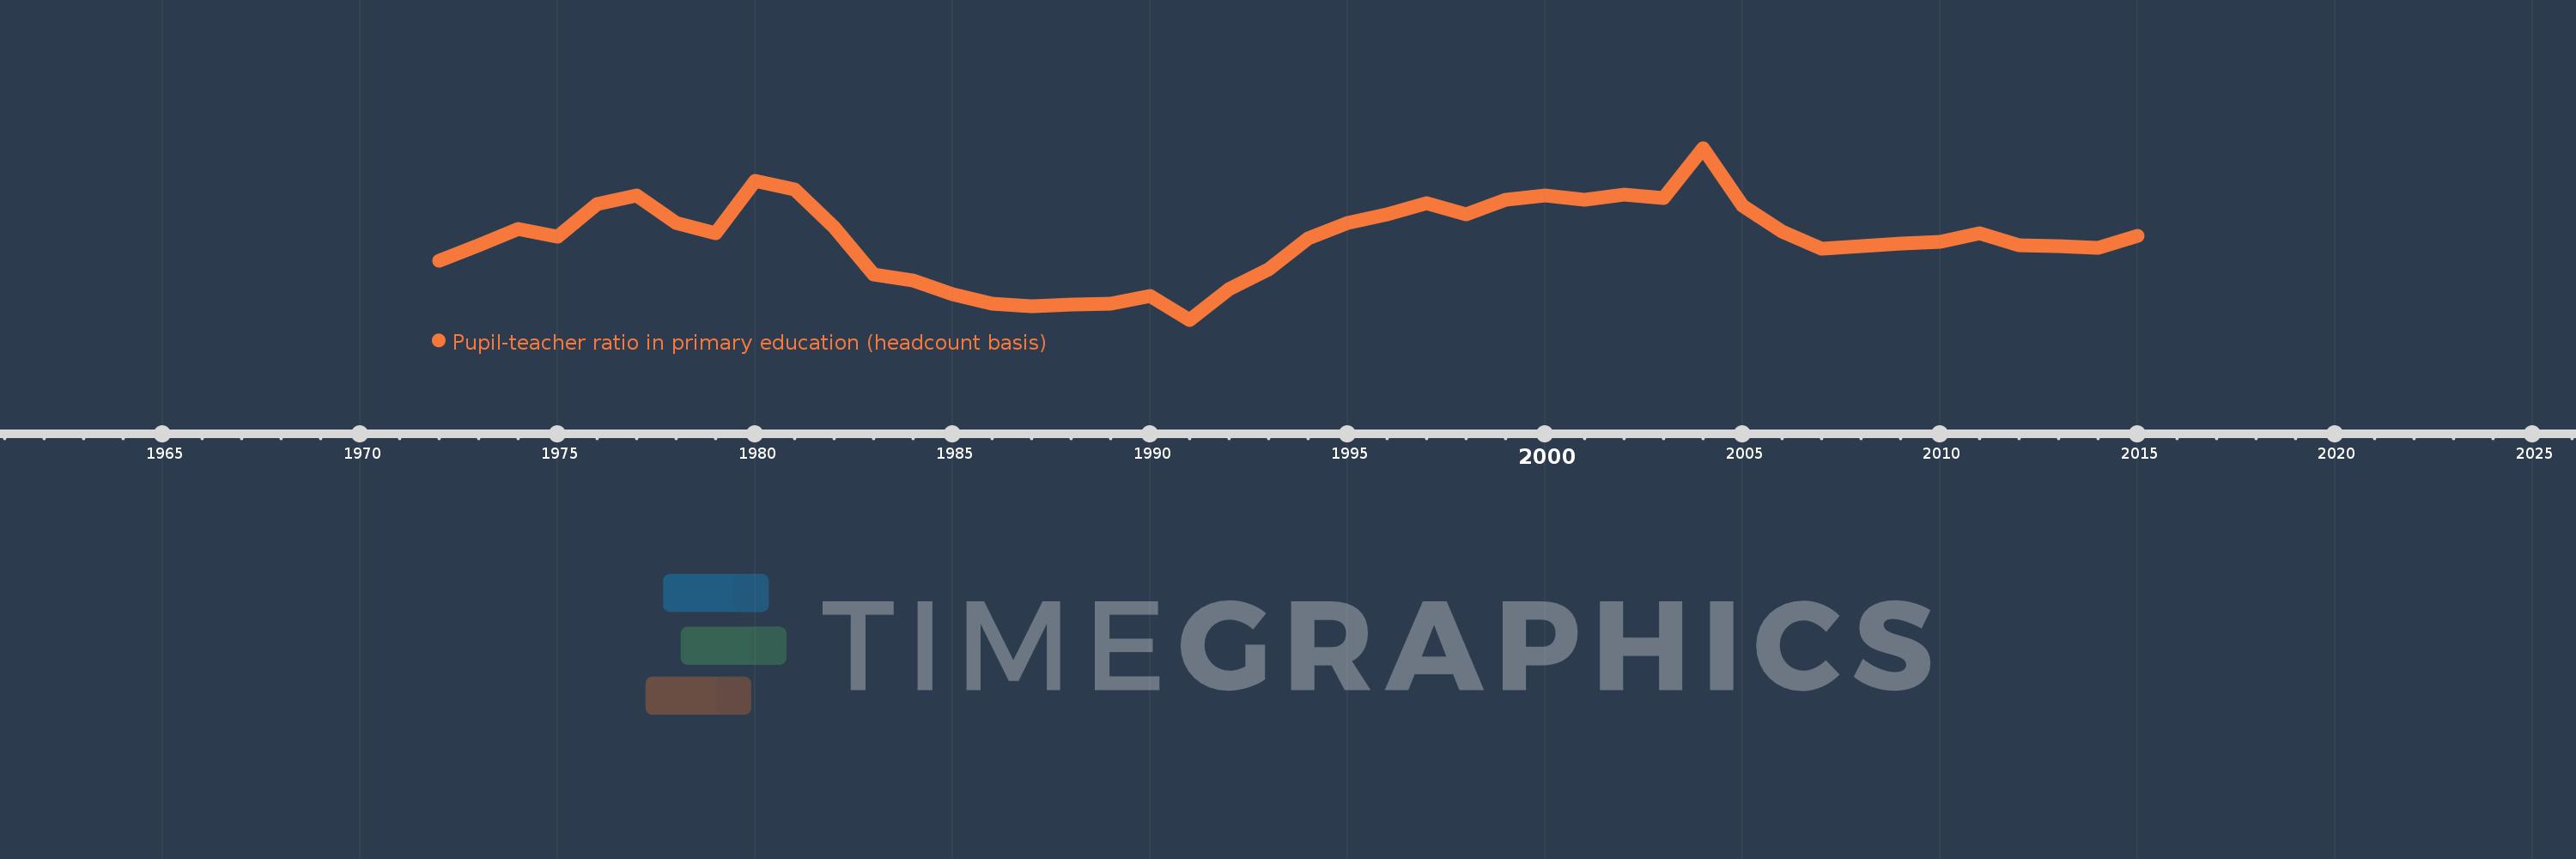
Pupil-teacher ratio in primary education (headcount basis)
2015,2014,2013,2012,2011,2010,2009,2007,2006,2005,2004,2003,2002,2001,2000,1999,1998,1997,1996,1995,1994,1993,1992,1991,1990,1989,1988,1987,1986,1985,1984,1983,1982,1981,1980,1979,1978,1977,1976,1975,1974,1973,1972
This statistics in other country:
AfghanistanAlbaniaAlgeriaAndorraAngolaAntigua and BarbudaArab WorldArgentinaArmeniaArubaAustraliaAustriaAzerbaijanBahamas, TheBahrainBangladeshBarbadosBelarusBelgiumBelizeBeninBermudaBhutanBoliviaBosnia and HerzegovinaBotswanaBrazilBritish Virgin IslandsBrunei DarussalamBulgariaBurkina FasoBurundiCabo VerdeCambodiaCameroonCanadaCaribbean small statesCayman IslandsCentral African RepublicCentral Europe and the BalticsChadChileChinaColombiaComorosCongo, Dem. Rep.Congo, Rep.Costa RicaCote d'IvoireCroatiaCubaCyprusCzech RepublicDenmarkDjiboutiDominicaDominican RepublicEarly-demographic dividendEast Asia & PacificEast Asia & Pacific (excluding high income)East Asia & Pacific (IDA & IBRD countries)EcuadorEgypt, Arab Rep.El SalvadorEquatorial GuineaEritreaEstoniaEthiopiaEuro areaEurope & Central AsiaEurope & Central Asia (excluding high income)Europe & Central Asia (IDA & IBRD countries)European UnionFijiFinlandFragile and conflict affected situationsFranceGabonGambia, TheGeorgiaGermanyGhanaGibraltarGreeceGrenadaGuatemalaGuineaGuinea-BissauGuyanaHaitiHeavily indebted poor countries (HIPC)High incomeHondurasHong Kong SAR, ChinaHungaryIBRD onlyIcelandIDA & IBRD totalIDA blendIDA onlyIDA totalIndiaIndonesiaIran, Islamic Rep.IraqIrelandIsraelItalyJamaicaJapanJordanKazakhstanKenyaKiribatiKorea, Dem. People’s Rep.Korea, Rep.KuwaitKyrgyz RepublicLao PDRLate-demographic dividendLatin America & Caribbean Latin America & Caribbean (excluding high income)Latin America & the Caribbean (IDA & IBRD countries)LatviaLeast developed countries: UN classificationLebanonLesothoLiberiaLibyaLiechtensteinLithuaniaLow & middle incomeLow incomeLower middle incomeLuxembourgMacao SAR, ChinaMacedonia, FYRMadagascarMalawiMalaysiaMaldivesMaliMaltaMarshall IslandsMauritaniaMauritiusMexicoMicronesia, Fed. Sts.Middle East & North AfricaMiddle East & North Africa (excluding high income)Middle East & North Africa (IDA & IBRD countries)Middle incomeMoldovaMonacoMongoliaMoroccoMozambiqueMyanmarNamibiaNauruNepalNetherlandsNew ZealandNicaraguaNigerNigeriaNorth AmericaNorwayOECD membersOmanOther small statesPacific island small statesPakistanPalauPanamaPapua New GuineaParaguayPeruPhilippinesPolandPortugalPost-demographic dividendPre-demographic dividendPuerto RicoQatarRomaniaRussian FederationRwandaSamoaSan MarinoSao Tome and PrincipeSaudi ArabiaSenegalSerbiaSeychellesSierra LeoneSingaporeSint Maarten (Dutch part)Slovak RepublicSloveniaSmall statesSolomon IslandsSomaliaSouth AfricaSouth AsiaSouth Asia (IDA & IBRD)South SudanSpainSri LankaSt. Kitts and NevisSt. LuciaSt. Vincent and the GrenadinesSub-Saharan Africa Sub-Saharan Africa (excluding high income)Sub-Saharan Africa (IDA & IBRD countries)SudanSurinameSwazilandSwedenSwitzerlandSyrian Arab RepublicTajikistanTanzaniaThailandTimor-LesteTogoTongaTrinidad and TobagoTunisiaTurkeyTurks and Caicos IslandsTuvaluUgandaUkraineUnited Arab EmiratesUnited KingdomUnited StatesUpper middle incomeUruguayUzbekistanVanuatuVenezuela, RBVietnamWest Bank and GazaWorldYemen, Rep.ZambiaZimbabwe Timeline:
This timeline shows a graph from 1972 to 2015 of Benin. No data until 1971. Number of actual observations by date: 43.
Source name:
World Development Indicators
Source organization:
UNESCO Institute for Statistics
Categories, topics:
Education
Last updated:
apr 23, 2017
Indicators value changes by year
Minimum:
30.546
jan 1, 1991
Maximum:
62.171
jan 1, 2004
At the date of observation
Value
Absolute change
Change from previous value
jan 1, 1972
41.368
+41.368
0.0%
jan 1, 1973
44.26
+2.892
6.99%
jan 1, 1974
47.288
+3.028
6.84%
jan 1, 1975
45.797
-1.491
-3.15%
jan 1, 1976
51.833
+6.037
13.18%
jan 1, 1977
53.429
+1.596
3.08%
jan 1, 1978
48.336
-5.093
-9.53%
jan 1, 1979
46.419
-1.917
-3.97%
jan 1, 1980
56.043
+9.624
20.73%
jan 1, 1981
54.582
-1.461
-2.61%
jan 1, 1982
47.526
-7.056
-12.93%
jan 1, 1983
38.946
-8.581
-18.05%
jan 1, 1984
37.762
-1.184
-3.04%
jan 1, 1985
35.287
-2.476
-6.56%
jan 1, 1986
33.479
-1.808
-5.12%
jan 1, 1987
33.018
-0.461
-1.38%
jan 1, 1988
33.325
+0.307
0.93%
jan 1, 1989
33.431
+0.106
0.32%
jan 1, 1990
34.907
+1.476
4.41%
jan 1, 1991
30.546
-4.361
-12.49%
jan 1, 1992
36.156
+5.609
18.36%
jan 1, 1993
39.846
+3.69
10.21%
jan 1, 1994
45.497
+5.651
14.18%
jan 1, 1995
48.342
+2.846
6.25%
jan 1, 1996
49.897
+1.554
3.22%
jan 1, 1997
51.995
+2.098
4.21%
jan 1, 1998
49.977
-2.018
-3.88%
jan 1, 1999
52.567
+2.591
5.18%
jan 1, 2000
53.396
+0.828
1.58%
jan 1, 2001
52.65
-0.746
-1.4%
jan 1, 2002
53.523
+0.873
1.66%
jan 1, 2003
52.963
-0.56
-1.05%
jan 1, 2004
62.171
+9.207
17.38%
jan 1, 2005
51.583
-10.588
-17.03%
jan 1, 2006
46.829
-4.754
-9.22%
jan 1, 2007
43.623
-3.206
-6.85%
jan 1, 2009
44.553
+0.93
2.13%
jan 1, 2010
44.868
+0.315
0.71%
jan 1, 2011
46.392
+1.524
3.4%
jan 1, 2012
44.201
-2.191
-4.72%
jan 1, 2013
44.15
-0.051
-0.12%
jan 1, 2014
43.729
-0.421
-0.95%
jan 1, 2015
45.923
+2.195
5.02%
Ranking of countries by current statistics by years


Comments: