29
/
en
AIzaSyAYiBZKx7MnpbEhh9jyipgxe19OcubqV5w
April 1, 2024
160936
Israel
ISR
true
2
1
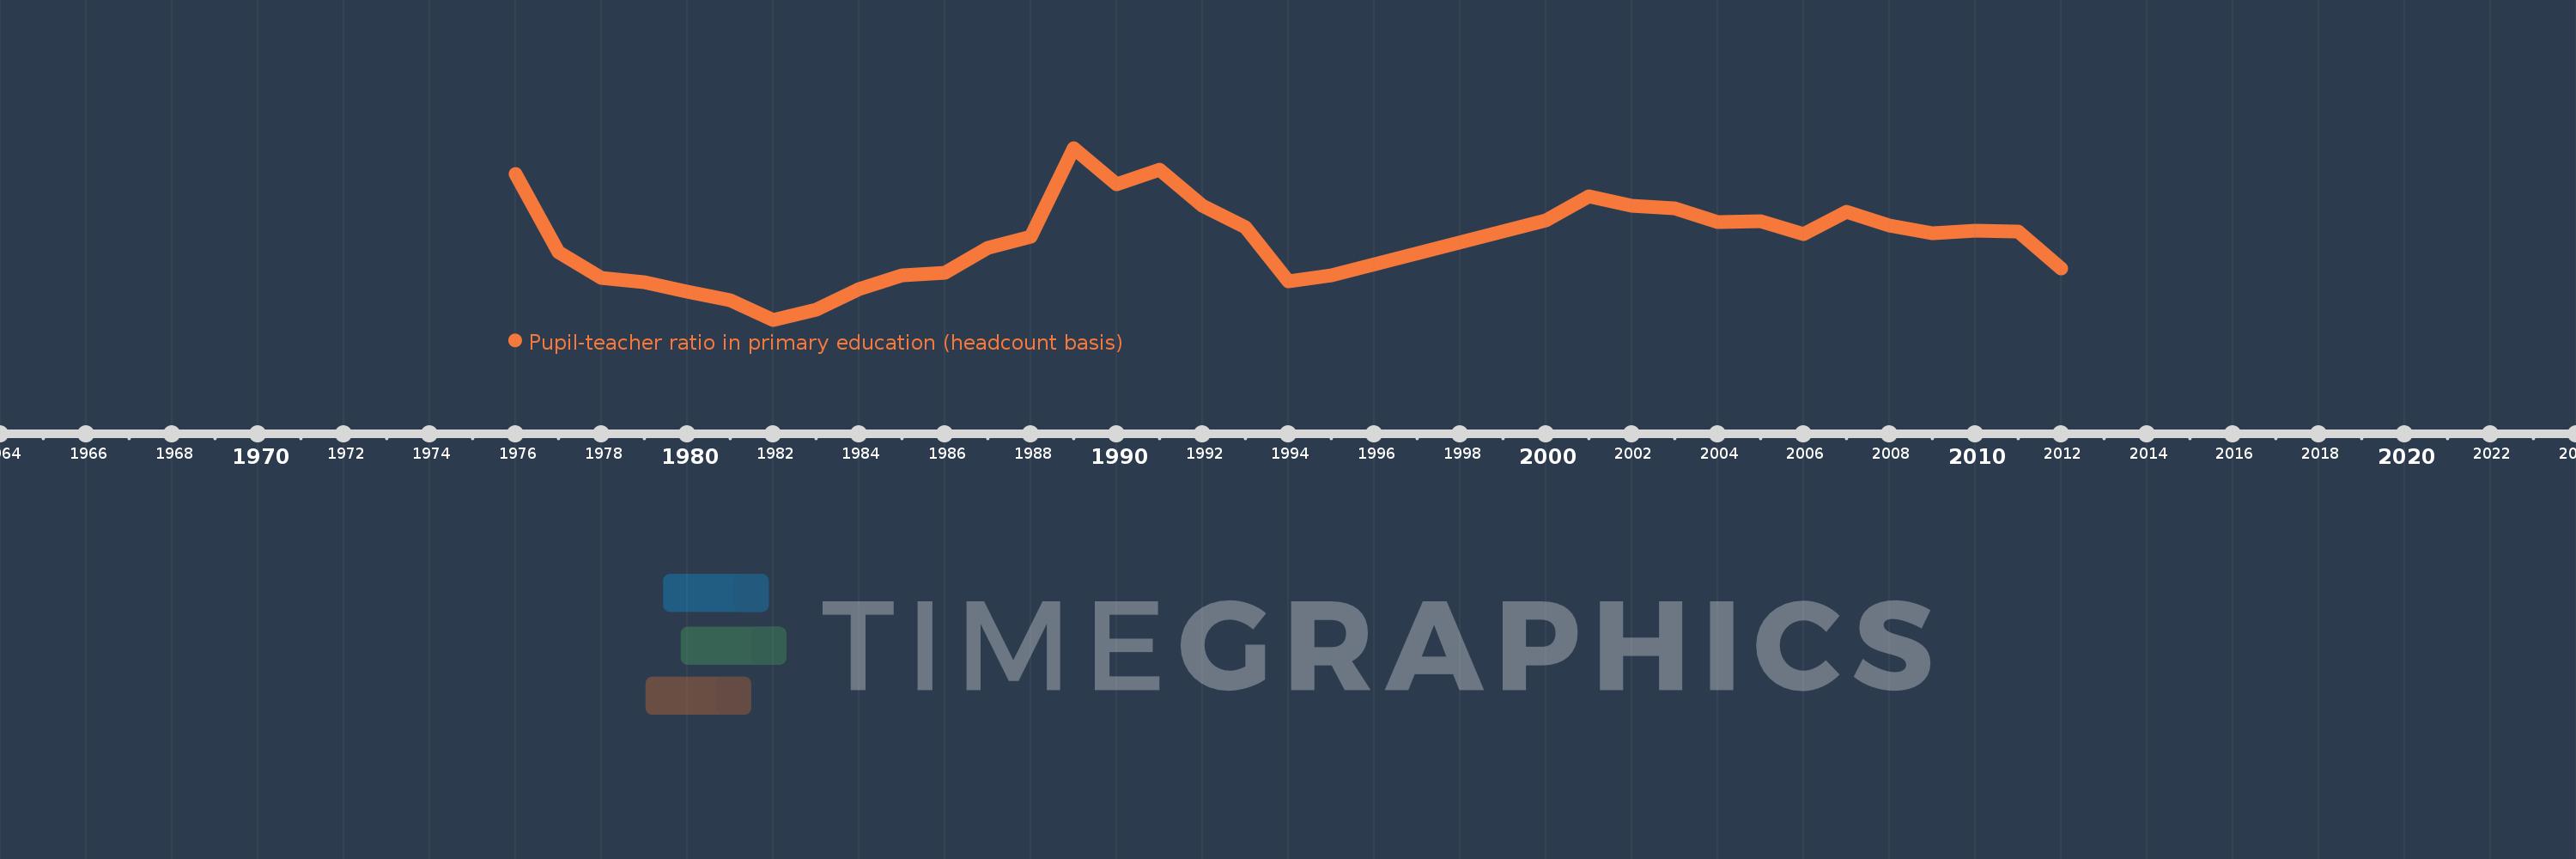
Pupil-teacher ratio in primary education (headcount basis)
2012,2011,2010,2009,2008,2007,2006,2005,2004,2003,2002,2001,2000,1995,1994,1993,1992,1991,1990,1989,1988,1987,1986,1985,1984,1983,1982,1981,1980,1979,1978,1977,1976
This statistics in other country:
AfghanistanAlbaniaAlgeriaAndorraAngolaAntigua and BarbudaArab WorldArgentinaArmeniaArubaAustraliaAustriaAzerbaijanBahamas, TheBahrainBangladeshBarbadosBelarusBelgiumBelizeBeninBermudaBhutanBoliviaBosnia and HerzegovinaBotswanaBrazilBritish Virgin IslandsBrunei DarussalamBulgariaBurkina FasoBurundiCabo VerdeCambodiaCameroonCanadaCaribbean small statesCayman IslandsCentral African RepublicCentral Europe and the BalticsChadChileChinaColombiaComorosCongo, Dem. Rep.Congo, Rep.Costa RicaCote d'IvoireCroatiaCubaCyprusCzech RepublicDenmarkDjiboutiDominicaDominican RepublicEarly-demographic dividendEast Asia & PacificEast Asia & Pacific (excluding high income)East Asia & Pacific (IDA & IBRD countries)EcuadorEgypt, Arab Rep.El SalvadorEquatorial GuineaEritreaEstoniaEthiopiaEuro areaEurope & Central AsiaEurope & Central Asia (excluding high income)Europe & Central Asia (IDA & IBRD countries)European UnionFijiFinlandFragile and conflict affected situationsFranceGabonGambia, TheGeorgiaGermanyGhanaGibraltarGreeceGrenadaGuatemalaGuineaGuinea-BissauGuyanaHaitiHeavily indebted poor countries (HIPC)High incomeHondurasHong Kong SAR, ChinaHungaryIBRD onlyIcelandIDA & IBRD totalIDA blendIDA onlyIDA totalIndiaIndonesiaIran, Islamic Rep.IraqIrelandIsraelItalyJamaicaJapanJordanKazakhstanKenyaKiribatiKorea, Dem. People’s Rep.Korea, Rep.KuwaitKyrgyz RepublicLao PDRLate-demographic dividendLatin America & Caribbean Latin America & Caribbean (excluding high income)Latin America & the Caribbean (IDA & IBRD countries)LatviaLeast developed countries: UN classificationLebanonLesothoLiberiaLibyaLiechtensteinLithuaniaLow & middle incomeLow incomeLower middle incomeLuxembourgMacao SAR, ChinaMacedonia, FYRMadagascarMalawiMalaysiaMaldivesMaliMaltaMarshall IslandsMauritaniaMauritiusMexicoMicronesia, Fed. Sts.Middle East & North AfricaMiddle East & North Africa (excluding high income)Middle East & North Africa (IDA & IBRD countries)Middle incomeMoldovaMonacoMongoliaMoroccoMozambiqueMyanmarNamibiaNauruNepalNetherlandsNew ZealandNicaraguaNigerNigeriaNorth AmericaNorwayOECD membersOmanOther small statesPacific island small statesPakistanPalauPanamaPapua New GuineaParaguayPeruPhilippinesPolandPortugalPost-demographic dividendPre-demographic dividendPuerto RicoQatarRomaniaRussian FederationRwandaSamoaSan MarinoSao Tome and PrincipeSaudi ArabiaSenegalSerbiaSeychellesSierra LeoneSingaporeSint Maarten (Dutch part)Slovak RepublicSloveniaSmall statesSolomon IslandsSomaliaSouth AfricaSouth AsiaSouth Asia (IDA & IBRD)South SudanSpainSri LankaSt. Kitts and NevisSt. LuciaSt. Vincent and the GrenadinesSub-Saharan Africa Sub-Saharan Africa (excluding high income)Sub-Saharan Africa (IDA & IBRD countries)SudanSurinameSwazilandSwedenSwitzerlandSyrian Arab RepublicTajikistanTanzaniaThailandTimor-LesteTogoTongaTrinidad and TobagoTunisiaTurkeyTurks and Caicos IslandsTuvaluUgandaUkraineUnited Arab EmiratesUnited KingdomUnited StatesUpper middle incomeUruguayUzbekistanVanuatuVenezuela, RBVietnamWest Bank and GazaWorldYemen, Rep.ZambiaZimbabwe Timeline:
This timeline shows a graph from 1976 to 2012 of Israel. No data until 1975. Number of actual observations by date: 33.
Source name:
World Development Indicators
Source organization:
UNESCO Institute for Statistics
Categories, topics:
Education
Last updated:
apr 23, 2017
Indicators value changes by year
Minimum:
11.752
jan 1, 1982
Maximum:
14.286
jan 1, 1989
At the date of observation
Value
Absolute change
Change from previous value
jan 1, 1976
13.898
+13.898
0.0%
jan 1, 1977
12.745
-1.153
-8.3%
jan 1, 1978
12.375
-0.37
-2.9%
jan 1, 1979
12.312
-0.064
-0.51%
jan 1, 1980
12.172
-0.14
-1.14%
jan 1, 1981
12.041
-0.131
-1.07%
jan 1, 1982
11.752
-0.289
-2.4%
jan 1, 1983
11.903
+0.15
1.28%
jan 1, 1984
12.199
+0.296
2.49%
jan 1, 1985
12.412
+0.213
1.75%
jan 1, 1986
12.448
+0.036
0.29%
jan 1, 1987
12.816
+0.368
2.96%
jan 1, 1988
12.974
+0.158
1.23%
jan 1, 1989
14.286
+1.312
10.12%
jan 1, 1990
13.754
-0.532
-3.72%
jan 1, 1991
13.969
+0.215
1.56%
jan 1, 1992
13.427
-0.542
-3.88%
jan 1, 1993
13.122
-0.305
-2.27%
jan 1, 1994
12.315
-0.807
-6.15%
jan 1, 1995
12.404
+0.089
0.72%
jan 1, 2000
13.223
+0.819
6.6%
jan 1, 2001
13.571
+0.348
2.63%
jan 1, 2002
13.436
-0.135
-0.99%
jan 1, 2003
13.397
-0.038
-0.29%
jan 1, 2004
13.192
-0.205
-1.53%
jan 1, 2005
13.201
+0.008
0.06%
jan 1, 2006
13.019
-0.182
-1.38%
jan 1, 2007
13.347
+0.328
2.52%
jan 1, 2008
13.141
-0.205
-1.54%
jan 1, 2009
13.026
-0.116
-0.88%
jan 1, 2010
13.068
+0.042
0.32%
jan 1, 2011
13.059
-0.009
-0.07%
jan 1, 2012
12.503
-0.556
-4.26%
Ranking of countries by current statistics by years


Comments: