29
/
en
AIzaSyAYiBZKx7MnpbEhh9jyipgxe19OcubqV5w
April 1, 2024
265223
Togo
TGO
true
2
1
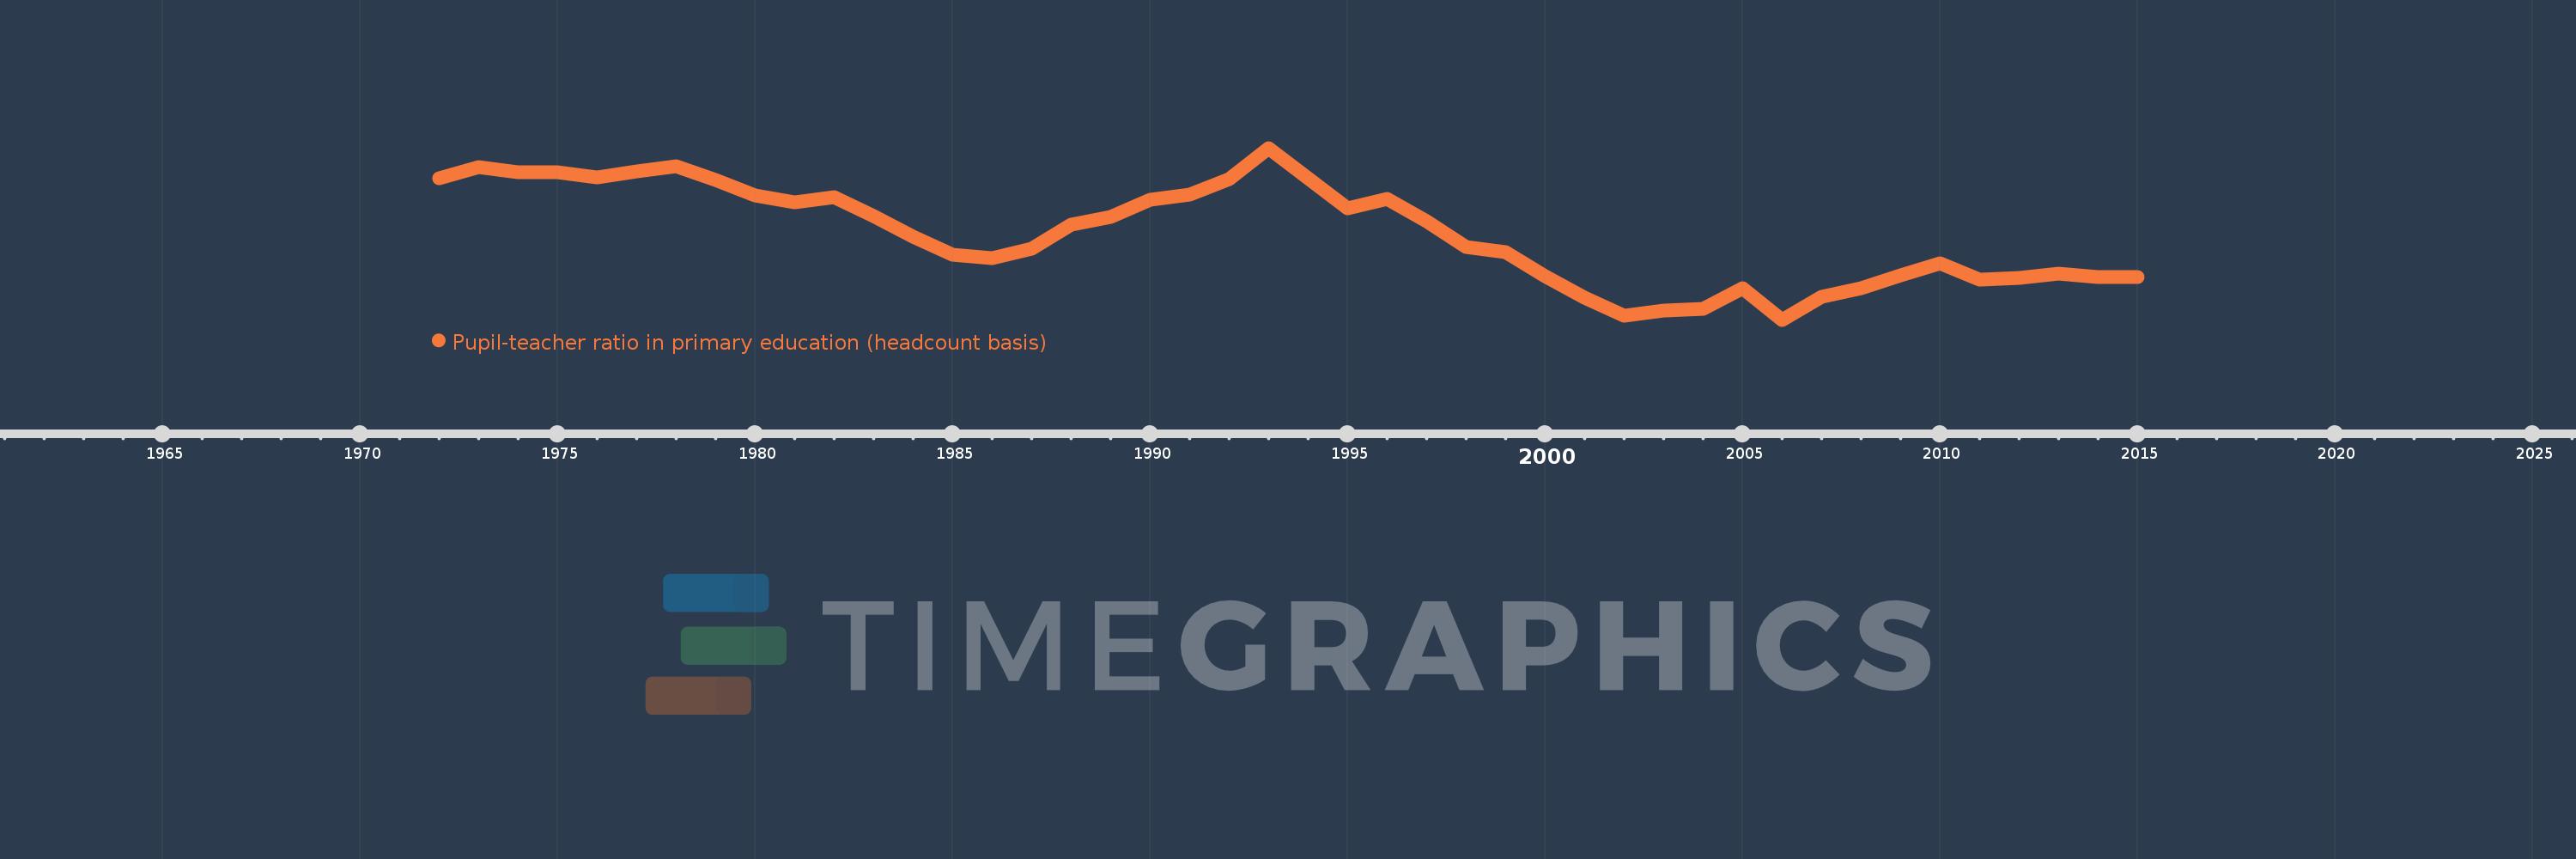
Pupil-teacher ratio in primary education (headcount basis)
2015,2014,2013,2012,2011,2010,2009,2008,2007,2006,2005,2004,2003,2002,2001,2000,1999,1998,1997,1996,1995,1993,1992,1991,1990,1989,1988,1987,1986,1985,1984,1983,1982,1981,1980,1979,1978,1977,1976,1975,1974,1973,1972
This statistics in other country:
AfghanistanAlbaniaAlgeriaAndorraAngolaAntigua and BarbudaArab WorldArgentinaArmeniaArubaAustraliaAustriaAzerbaijanBahamas, TheBahrainBangladeshBarbadosBelarusBelgiumBelizeBeninBermudaBhutanBoliviaBosnia and HerzegovinaBotswanaBrazilBritish Virgin IslandsBrunei DarussalamBulgariaBurkina FasoBurundiCabo VerdeCambodiaCameroonCanadaCaribbean small statesCayman IslandsCentral African RepublicCentral Europe and the BalticsChadChileChinaColombiaComorosCongo, Dem. Rep.Congo, Rep.Costa RicaCote d'IvoireCroatiaCubaCyprusCzech RepublicDenmarkDjiboutiDominicaDominican RepublicEarly-demographic dividendEast Asia & PacificEast Asia & Pacific (excluding high income)East Asia & Pacific (IDA & IBRD countries)EcuadorEgypt, Arab Rep.El SalvadorEquatorial GuineaEritreaEstoniaEthiopiaEuro areaEurope & Central AsiaEurope & Central Asia (excluding high income)Europe & Central Asia (IDA & IBRD countries)European UnionFijiFinlandFragile and conflict affected situationsFranceGabonGambia, TheGeorgiaGermanyGhanaGibraltarGreeceGrenadaGuatemalaGuineaGuinea-BissauGuyanaHaitiHeavily indebted poor countries (HIPC)High incomeHondurasHong Kong SAR, ChinaHungaryIBRD onlyIcelandIDA & IBRD totalIDA blendIDA onlyIDA totalIndiaIndonesiaIran, Islamic Rep.IraqIrelandIsraelItalyJamaicaJapanJordanKazakhstanKenyaKiribatiKorea, Dem. People’s Rep.Korea, Rep.KuwaitKyrgyz RepublicLao PDRLate-demographic dividendLatin America & Caribbean Latin America & Caribbean (excluding high income)Latin America & the Caribbean (IDA & IBRD countries)LatviaLeast developed countries: UN classificationLebanonLesothoLiberiaLibyaLiechtensteinLithuaniaLow & middle incomeLow incomeLower middle incomeLuxembourgMacao SAR, ChinaMacedonia, FYRMadagascarMalawiMalaysiaMaldivesMaliMaltaMarshall IslandsMauritaniaMauritiusMexicoMicronesia, Fed. Sts.Middle East & North AfricaMiddle East & North Africa (excluding high income)Middle East & North Africa (IDA & IBRD countries)Middle incomeMoldovaMonacoMongoliaMoroccoMozambiqueMyanmarNamibiaNauruNepalNetherlandsNew ZealandNicaraguaNigerNigeriaNorth AmericaNorwayOECD membersOmanOther small statesPacific island small statesPakistanPalauPanamaPapua New GuineaParaguayPeruPhilippinesPolandPortugalPost-demographic dividendPre-demographic dividendPuerto RicoQatarRomaniaRussian FederationRwandaSamoaSan MarinoSao Tome and PrincipeSaudi ArabiaSenegalSerbiaSeychellesSierra LeoneSingaporeSint Maarten (Dutch part)Slovak RepublicSloveniaSmall statesSolomon IslandsSomaliaSouth AfricaSouth AsiaSouth Asia (IDA & IBRD)South SudanSpainSri LankaSt. Kitts and NevisSt. LuciaSt. Vincent and the GrenadinesSub-Saharan Africa Sub-Saharan Africa (excluding high income)Sub-Saharan Africa (IDA & IBRD countries)SudanSurinameSwazilandSwedenSwitzerlandSyrian Arab RepublicTajikistanTanzaniaThailandTimor-LesteTogoTongaTrinidad and TobagoTunisiaTurkeyTurks and Caicos IslandsTuvaluUgandaUkraineUnited Arab EmiratesUnited KingdomUnited StatesUpper middle incomeUruguayUzbekistanVanuatuVenezuela, RBVietnamWest Bank and GazaWorldYemen, Rep.ZambiaZimbabwe Timeline:
This timeline shows a graph from 1972 to 2015 of Togo. No data until 1971. Number of actual observations by date: 43.
Source name:
World Development Indicators
Source organization:
UNESCO Institute for Statistics
Categories, topics:
Education
Last updated:
apr 23, 2017
Indicators value changes by year
Minimum:
33.595
jan 1, 2006
Maximum:
63.788
jan 1, 1993
At the date of observation
Value
Absolute change
Change from previous value
jan 1, 1972
58.456
+58.456
0.0%
jan 1, 1973
60.378
+1.922
3.29%
jan 1, 1974
59.486
-0.892
-1.48%
jan 1, 1975
59.503
+0.017
0.03%
jan 1, 1976
58.547
-0.956
-1.61%
jan 1, 1977
59.687
+1.14
1.95%
jan 1, 1978
60.567
+0.88
1.47%
jan 1, 1979
58.121
-2.446
-4.04%
jan 1, 1980
55.434
-2.687
-4.62%
jan 1, 1981
54.291
-1.143
-2.06%
jan 1, 1982
55.08
+0.789
1.45%
jan 1, 1983
51.839
-3.241
-5.88%
jan 1, 1984
48.201
-3.638
-7.02%
jan 1, 1985
45.084
-3.118
-6.47%
jan 1, 1986
44.421
-0.662
-1.47%
jan 1, 1987
46.06
+1.639
3.69%
jan 1, 1988
50.257
+4.196
9.11%
jan 1, 1989
51.664
+1.408
2.8%
jan 1, 1990
54.612
+2.948
5.71%
jan 1, 1991
55.639
+1.026
1.88%
jan 1, 1992
58.259
+2.62
4.71%
jan 1, 1993
63.788
+5.529
9.49%
jan 1, 1995
53.105
-10.682
-16.75%
jan 1, 1996
54.862
+1.756
3.31%
jan 1, 1997
50.849
-4.012
-7.31%
jan 1, 1998
46.376
-4.474
-8.8%
jan 1, 1999
45.511
-0.865
-1.86%
jan 1, 2000
41.281
-4.23
-9.29%
jan 1, 2001
37.46
-3.821
-9.26%
jan 1, 2002
34.339
-3.121
-8.33%
jan 1, 2003
35.201
+0.862
2.51%
jan 1, 2004
35.452
+0.251
0.71%
jan 1, 2005
39.084
+3.633
10.25%
jan 1, 2006
33.595
-5.489
-14.04%
jan 1, 2007
37.563
+3.967
11.81%
jan 1, 2008
39.138
+1.575
4.19%
jan 1, 2009
41.326
+2.188
5.59%
jan 1, 2010
43.509
+2.184
5.28%
jan 1, 2011
40.573
-2.936
-6.75%
jan 1, 2012
40.948
+0.375
0.92%
jan 1, 2013
41.678
+0.73
1.78%
jan 1, 2014
41.087
-0.591
-1.42%
jan 1, 2015
41.137
+0.05
0.12%
Ranking of countries by current statistics by years


Comments: