29
/
en
AIzaSyAYiBZKx7MnpbEhh9jyipgxe19OcubqV5w
April 1, 2024
157894
Iran, Islamic Rep.
IRN
true
2
1
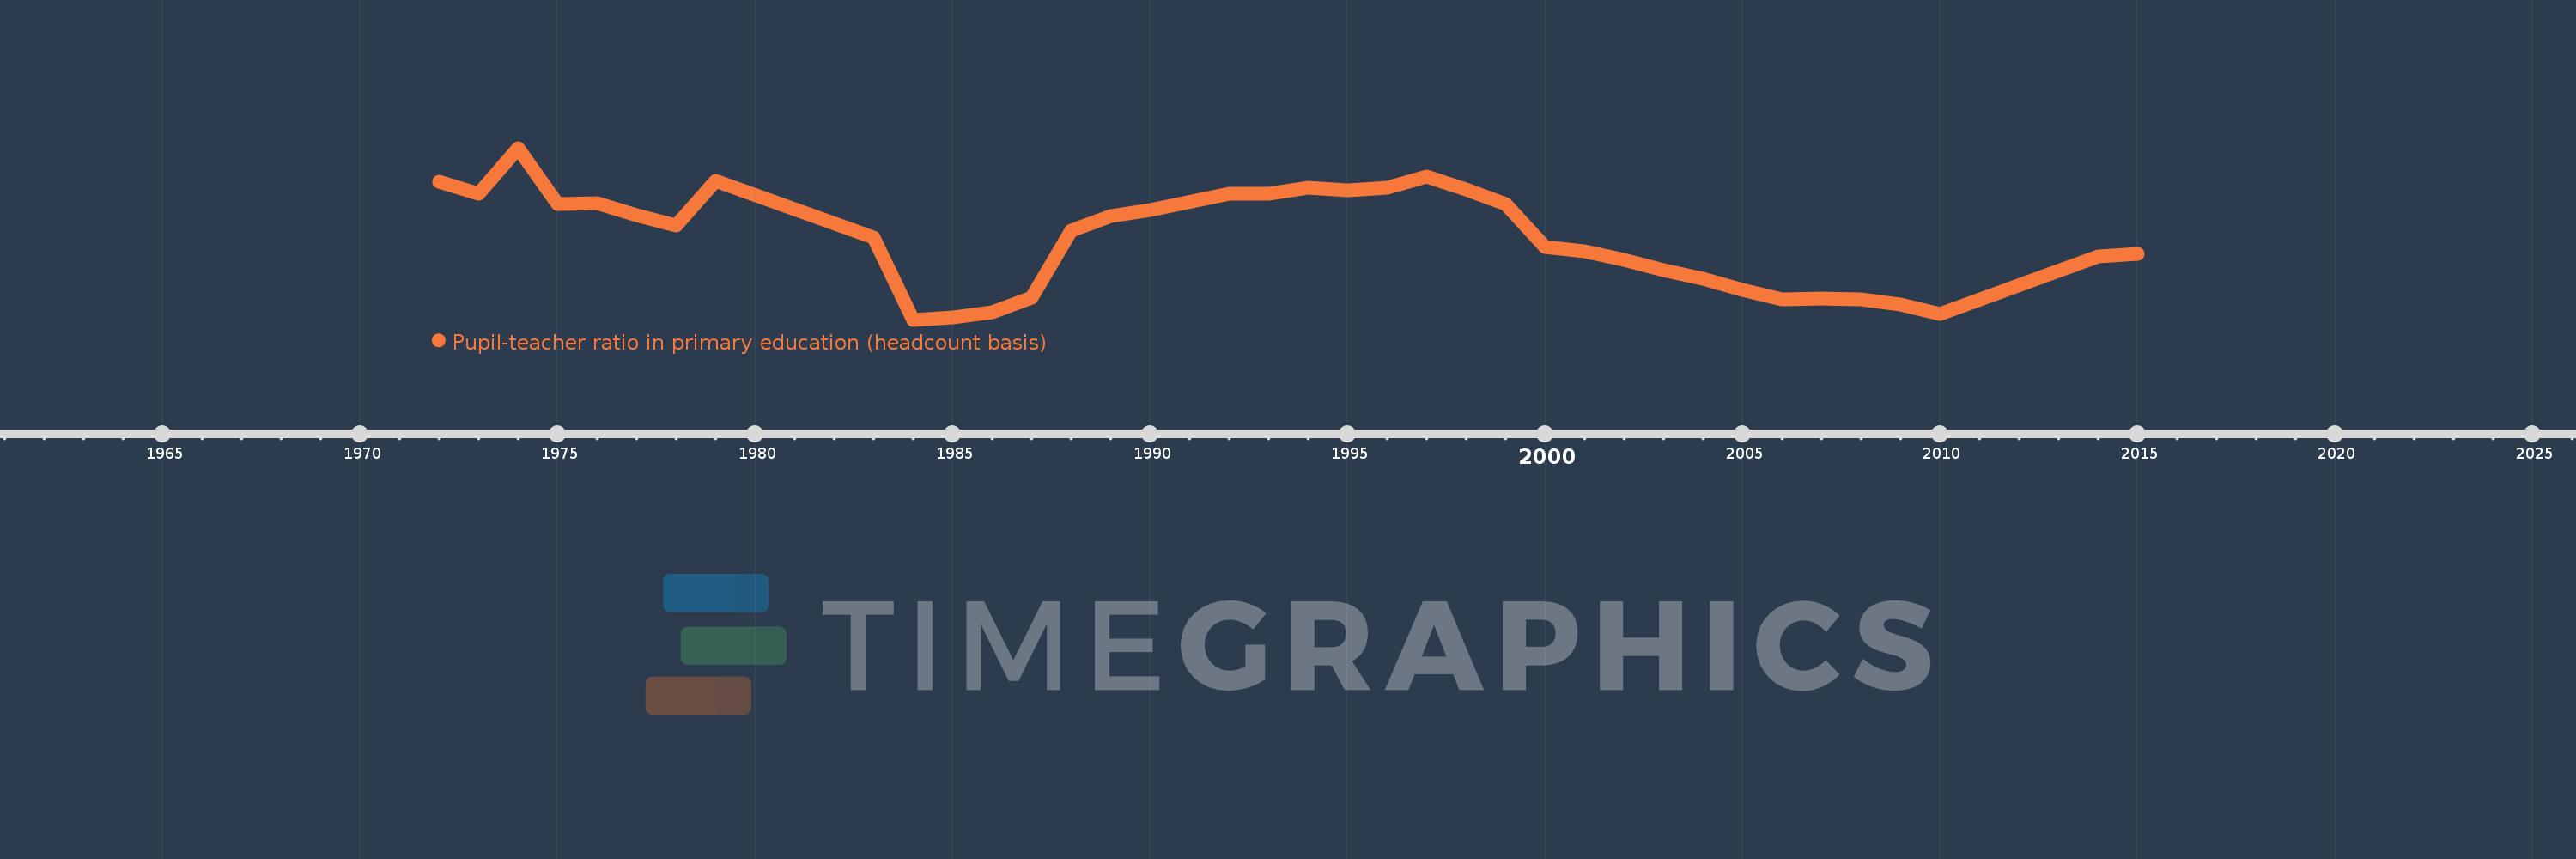
Pupil-teacher ratio in primary education (headcount basis)
2015,2014,2010,2009,2008,2007,2006,2005,2004,2003,2002,2001,2000,1999,1998,1997,1996,1995,1994,1993,1992,1990,1989,1988,1987,1986,1985,1984,1983,1979,1978,1977,1976,1975,1974,1973,1972
This statistics in other country:
AfghanistanAlbaniaAlgeriaAndorraAngolaAntigua and BarbudaArab WorldArgentinaArmeniaArubaAustraliaAustriaAzerbaijanBahamas, TheBahrainBangladeshBarbadosBelarusBelgiumBelizeBeninBermudaBhutanBoliviaBosnia and HerzegovinaBotswanaBrazilBritish Virgin IslandsBrunei DarussalamBulgariaBurkina FasoBurundiCabo VerdeCambodiaCameroonCanadaCaribbean small statesCayman IslandsCentral African RepublicCentral Europe and the BalticsChadChileChinaColombiaComorosCongo, Dem. Rep.Congo, Rep.Costa RicaCote d'IvoireCroatiaCubaCyprusCzech RepublicDenmarkDjiboutiDominicaDominican RepublicEarly-demographic dividendEast Asia & PacificEast Asia & Pacific (excluding high income)East Asia & Pacific (IDA & IBRD countries)EcuadorEgypt, Arab Rep.El SalvadorEquatorial GuineaEritreaEstoniaEthiopiaEuro areaEurope & Central AsiaEurope & Central Asia (excluding high income)Europe & Central Asia (IDA & IBRD countries)European UnionFijiFinlandFragile and conflict affected situationsFranceGabonGambia, TheGeorgiaGermanyGhanaGibraltarGreeceGrenadaGuatemalaGuineaGuinea-BissauGuyanaHaitiHeavily indebted poor countries (HIPC)High incomeHondurasHong Kong SAR, ChinaHungaryIBRD onlyIcelandIDA & IBRD totalIDA blendIDA onlyIDA totalIndiaIndonesiaIran, Islamic Rep.IraqIrelandIsraelItalyJamaicaJapanJordanKazakhstanKenyaKiribatiKorea, Dem. People’s Rep.Korea, Rep.KuwaitKyrgyz RepublicLao PDRLate-demographic dividendLatin America & Caribbean Latin America & Caribbean (excluding high income)Latin America & the Caribbean (IDA & IBRD countries)LatviaLeast developed countries: UN classificationLebanonLesothoLiberiaLibyaLiechtensteinLithuaniaLow & middle incomeLow incomeLower middle incomeLuxembourgMacao SAR, ChinaMacedonia, FYRMadagascarMalawiMalaysiaMaldivesMaliMaltaMarshall IslandsMauritaniaMauritiusMexicoMicronesia, Fed. Sts.Middle East & North AfricaMiddle East & North Africa (excluding high income)Middle East & North Africa (IDA & IBRD countries)Middle incomeMoldovaMonacoMongoliaMoroccoMozambiqueMyanmarNamibiaNauruNepalNetherlandsNew ZealandNicaraguaNigerNigeriaNorth AmericaNorwayOECD membersOmanOther small statesPacific island small statesPakistanPalauPanamaPapua New GuineaParaguayPeruPhilippinesPolandPortugalPost-demographic dividendPre-demographic dividendPuerto RicoQatarRomaniaRussian FederationRwandaSamoaSan MarinoSao Tome and PrincipeSaudi ArabiaSenegalSerbiaSeychellesSierra LeoneSingaporeSint Maarten (Dutch part)Slovak RepublicSloveniaSmall statesSolomon IslandsSomaliaSouth AfricaSouth AsiaSouth Asia (IDA & IBRD)South SudanSpainSri LankaSt. Kitts and NevisSt. LuciaSt. Vincent and the GrenadinesSub-Saharan Africa Sub-Saharan Africa (excluding high income)Sub-Saharan Africa (IDA & IBRD countries)SudanSurinameSwazilandSwedenSwitzerlandSyrian Arab RepublicTajikistanTanzaniaThailandTimor-LesteTogoTongaTrinidad and TobagoTunisiaTurkeyTurks and Caicos IslandsTuvaluUgandaUkraineUnited Arab EmiratesUnited KingdomUnited StatesUpper middle incomeUruguayUzbekistanVanuatuVenezuela, RBVietnamWest Bank and GazaWorldYemen, Rep.ZambiaZimbabwe Timeline:
This timeline shows a graph from 1972 to 2015 of Iran, Islamic Rep.. No data until 1971. Number of actual observations by date: 37.
Source name:
World Development Indicators
Source organization:
UNESCO Institute for Statistics
Categories, topics:
Education
Last updated:
apr 23, 2017
Indicators value changes by year
Minimum:
19.928
jan 1, 1984
Maximum:
35.495
jan 1, 1974
At the date of observation
Value
Absolute change
Change from previous value
jan 1, 1972
32.439
+32.439
0.0%
jan 1, 1973
31.328
-1.111
-3.42%
jan 1, 1974
35.495
+4.167
13.3%
jan 1, 1975
30.383
-5.112
-14.4%
jan 1, 1976
30.508
+0.125
0.41%
jan 1, 1977
29.376
-1.131
-3.71%
jan 1, 1978
28.476
-0.9
-3.06%
jan 1, 1979
32.48
+4.004
14.06%
jan 1, 1983
27.415
-5.065
-15.59%
jan 1, 1984
19.928
-7.487
-27.31%
jan 1, 1985
20.163
+0.235
1.18%
jan 1, 1986
20.614
+0.451
2.24%
jan 1, 1987
21.916
+1.302
6.32%
jan 1, 1988
28.027
+6.111
27.88%
jan 1, 1989
29.341
+1.314
4.69%
jan 1, 1990
29.889
+0.548
1.87%
jan 1, 1992
31.362
+1.473
4.93%
jan 1, 1993
31.343
-0.019
-0.06%
jan 1, 1994
31.867
+0.524
1.67%
jan 1, 1995
31.659
-0.208
-0.65%
jan 1, 1996
31.913
+0.254
0.8%
jan 1, 1997
32.868
+0.955
2.99%
jan 1, 1998
31.76
-1.108
-3.37%
jan 1, 1999
30.41
-1.351
-4.25%
jan 1, 2000
26.506
-3.904
-12.84%
jan 1, 2001
26.149
-0.357
-1.35%
jan 1, 2002
25.324
-0.824
-3.15%
jan 1, 2003
24.385
-0.94
-3.71%
jan 1, 2004
23.61
-0.775
-3.18%
jan 1, 2005
22.604
-1.005
-4.26%
jan 1, 2006
21.743
-0.862
-3.81%
jan 1, 2007
21.848
+0.105
0.48%
jan 1, 2008
21.785
-0.063
-0.29%
jan 1, 2009
21.33
-0.455
-2.09%
jan 1, 2010
20.488
-0.842
-3.95%
jan 1, 2014
25.655
+5.166
25.22%
jan 1, 2015
25.918
+0.264
1.03%
Ranking of countries by current statistics by years


Comments: