29
/
en
AIzaSyAYiBZKx7MnpbEhh9jyipgxe19OcubqV5w
April 1, 2024
25277
Caribbean small states
CSS
false
2
1
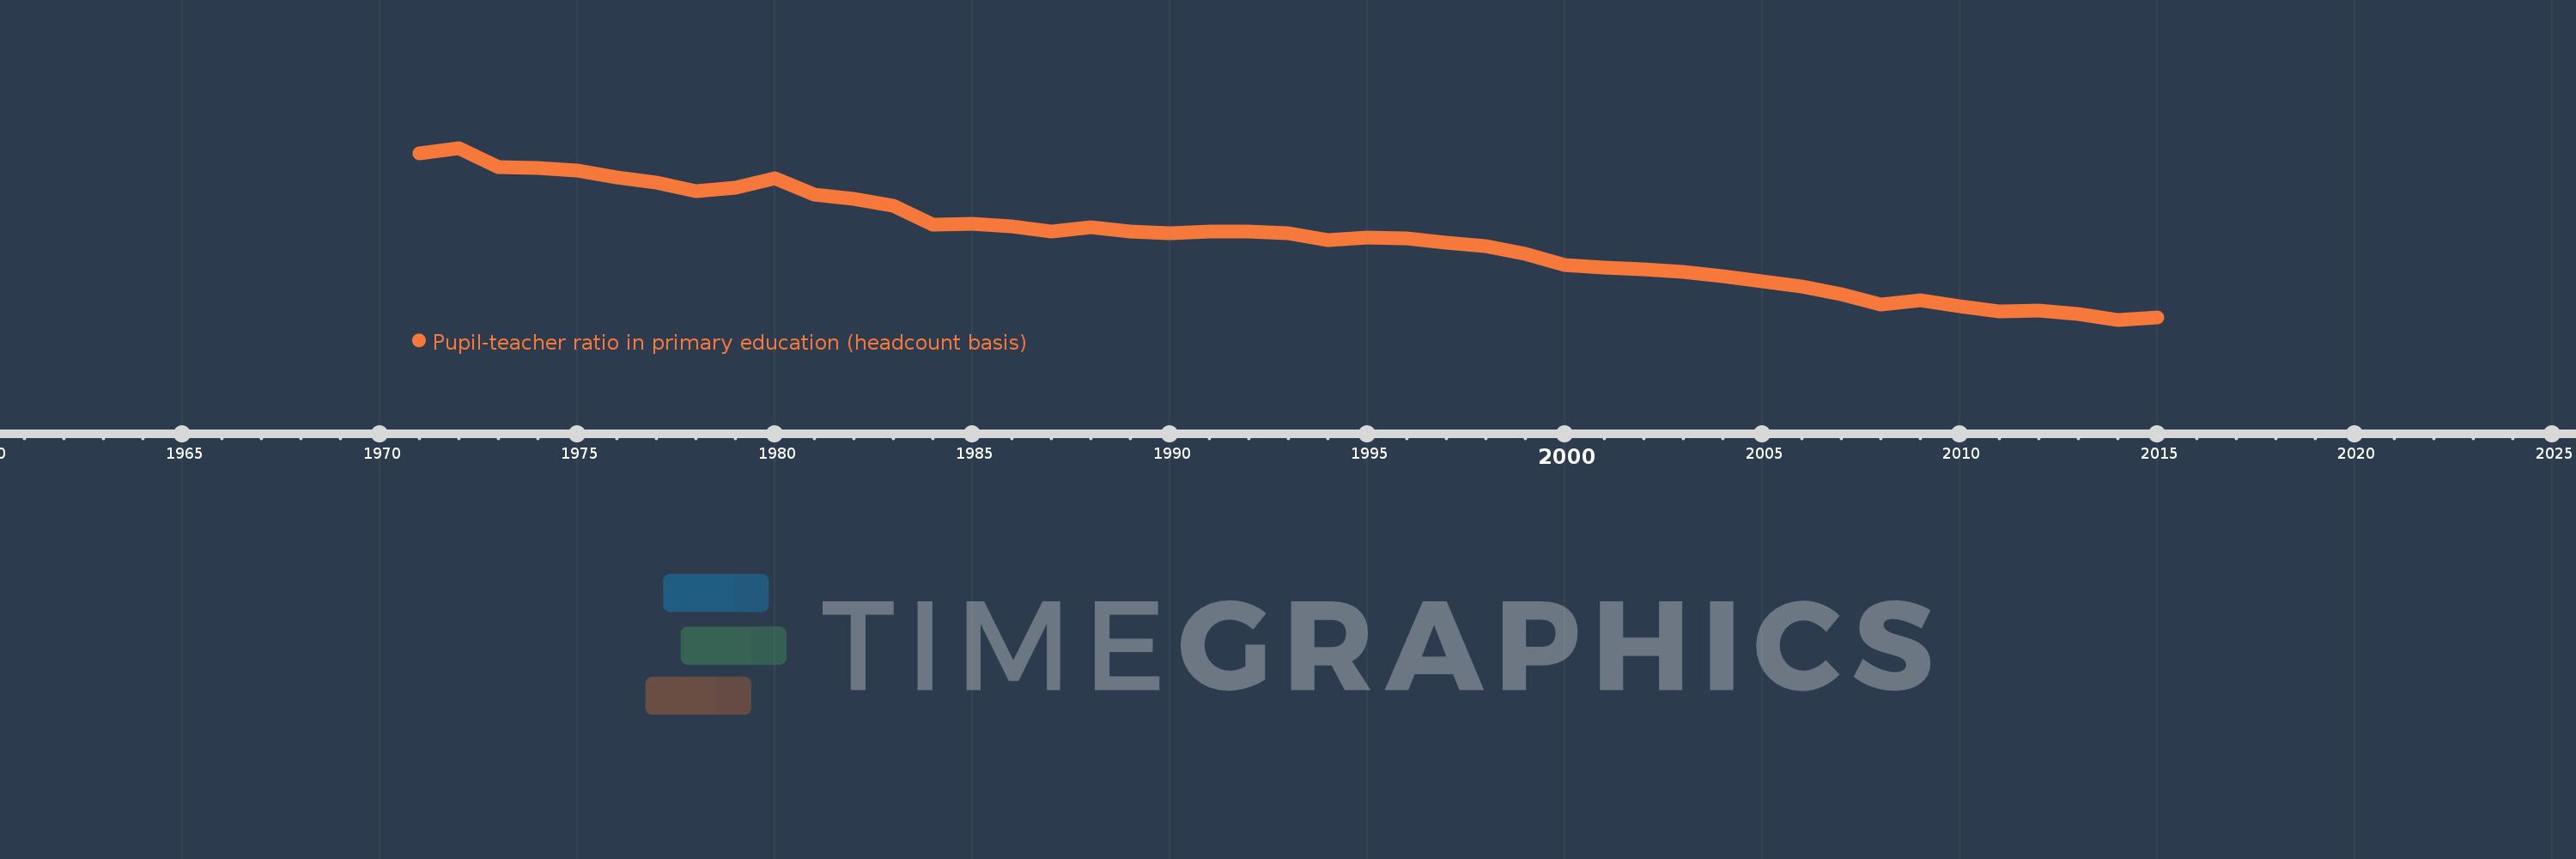
Pupil-teacher ratio in primary education (headcount basis)
2015,2014,2013,2012,2011,2010,2009,2008,2007,2006,2005,2004,2003,2002,2001,2000,1999,1998,1997,1996,1995,1994,1993,1992,1991,1990,1989,1988,1987,1986,1985,1984,1983,1982,1981,1980,1979,1978,1977,1976,1975,1974,1973,1972,1971
This statistics in other country:
AfghanistanAlbaniaAlgeriaAndorraAngolaAntigua and BarbudaArab WorldArgentinaArmeniaArubaAustraliaAustriaAzerbaijanBahamas, TheBahrainBangladeshBarbadosBelarusBelgiumBelizeBeninBermudaBhutanBoliviaBosnia and HerzegovinaBotswanaBrazilBritish Virgin IslandsBrunei DarussalamBulgariaBurkina FasoBurundiCabo VerdeCambodiaCameroonCanadaCaribbean small statesCayman IslandsCentral African RepublicCentral Europe and the BalticsChadChileChinaColombiaComorosCongo, Dem. Rep.Congo, Rep.Costa RicaCote d'IvoireCroatiaCubaCyprusCzech RepublicDenmarkDjiboutiDominicaDominican RepublicEarly-demographic dividendEast Asia & PacificEast Asia & Pacific (excluding high income)East Asia & Pacific (IDA & IBRD countries)EcuadorEgypt, Arab Rep.El SalvadorEquatorial GuineaEritreaEstoniaEthiopiaEuro areaEurope & Central AsiaEurope & Central Asia (excluding high income)Europe & Central Asia (IDA & IBRD countries)European UnionFijiFinlandFragile and conflict affected situationsFranceGabonGambia, TheGeorgiaGermanyGhanaGibraltarGreeceGrenadaGuatemalaGuineaGuinea-BissauGuyanaHaitiHeavily indebted poor countries (HIPC)High incomeHondurasHong Kong SAR, ChinaHungaryIBRD onlyIcelandIDA & IBRD totalIDA blendIDA onlyIDA totalIndiaIndonesiaIran, Islamic Rep.IraqIrelandIsraelItalyJamaicaJapanJordanKazakhstanKenyaKiribatiKorea, Dem. People’s Rep.Korea, Rep.KuwaitKyrgyz RepublicLao PDRLate-demographic dividendLatin America & Caribbean Latin America & Caribbean (excluding high income)Latin America & the Caribbean (IDA & IBRD countries)LatviaLeast developed countries: UN classificationLebanonLesothoLiberiaLibyaLiechtensteinLithuaniaLow & middle incomeLow incomeLower middle incomeLuxembourgMacao SAR, ChinaMacedonia, FYRMadagascarMalawiMalaysiaMaldivesMaliMaltaMarshall IslandsMauritaniaMauritiusMexicoMicronesia, Fed. Sts.Middle East & North AfricaMiddle East & North Africa (excluding high income)Middle East & North Africa (IDA & IBRD countries)Middle incomeMoldovaMonacoMongoliaMoroccoMozambiqueMyanmarNamibiaNauruNepalNetherlandsNew ZealandNicaraguaNigerNigeriaNorth AmericaNorwayOECD membersOmanOther small statesPacific island small statesPakistanPalauPanamaPapua New GuineaParaguayPeruPhilippinesPolandPortugalPost-demographic dividendPre-demographic dividendPuerto RicoQatarRomaniaRussian FederationRwandaSamoaSan MarinoSao Tome and PrincipeSaudi ArabiaSenegalSerbiaSeychellesSierra LeoneSingaporeSint Maarten (Dutch part)Slovak RepublicSloveniaSmall statesSolomon IslandsSomaliaSouth AfricaSouth AsiaSouth Asia (IDA & IBRD)South SudanSpainSri LankaSt. Kitts and NevisSt. LuciaSt. Vincent and the GrenadinesSub-Saharan Africa Sub-Saharan Africa (excluding high income)Sub-Saharan Africa (IDA & IBRD countries)SudanSurinameSwazilandSwedenSwitzerlandSyrian Arab RepublicTajikistanTanzaniaThailandTimor-LesteTogoTongaTrinidad and TobagoTunisiaTurkeyTurks and Caicos IslandsTuvaluUgandaUkraineUnited Arab EmiratesUnited KingdomUnited StatesUpper middle incomeUruguayUzbekistanVanuatuVenezuela, RBVietnamWest Bank and GazaWorldYemen, Rep.ZambiaZimbabwe Timeline:
This timeline shows a graph from 1971 to 2015 of Caribbean small states. No data until 1970. Number of actual observations by date: 45.
Source name:
World Development Indicators
Source organization:
UNESCO Institute for Statistics
Categories, topics:
Education
Last updated:
apr 23, 2017
Indicators value changes by year
Minimum:
18.551
jan 1, 2014
Maximum:
35.728
jan 1, 1972
At the date of observation
Value
Absolute change
Change from previous value
jan 1, 1971
35.196
+35.196
0.0%
jan 1, 1972
35.728
+0.532
1.51%
jan 1, 1973
33.79
-1.938
-5.43%
jan 1, 1974
33.751
-0.039
-0.11%
jan 1, 1975
33.481
-0.27
-0.8%
jan 1, 1976
32.749
-0.732
-2.19%
jan 1, 1977
32.235
-0.514
-1.57%
jan 1, 1978
31.366
-0.87
-2.7%
jan 1, 1979
31.769
+0.403
1.29%
jan 1, 1980
32.661
+0.892
2.81%
jan 1, 1981
31.058
-1.603
-4.91%
jan 1, 1982
30.628
-0.43
-1.38%
jan 1, 1983
29.932
-0.696
-2.27%
jan 1, 1984
28.025
-1.908
-6.37%
jan 1, 1985
28.152
+0.127
0.45%
jan 1, 1986
27.898
-0.253
-0.9%
jan 1, 1987
27.398
-0.501
-1.79%
jan 1, 1988
27.833
+0.435
1.59%
jan 1, 1989
27.378
-0.455
-1.63%
jan 1, 1990
27.23
-0.148
-0.54%
jan 1, 1991
27.393
+0.163
0.6%
jan 1, 1992
27.352
-0.041
-0.15%
jan 1, 1993
27.193
-0.158
-0.58%
jan 1, 1994
26.526
-0.667
-2.45%
jan 1, 1995
26.791
+0.265
1.0%
jan 1, 1996
26.648
-0.144
-0.54%
jan 1, 1997
26.261
-0.386
-1.45%
jan 1, 1998
25.877
-0.384
-1.46%
jan 1, 1999
25.1
-0.777
-3.0%
jan 1, 2000
24.007
-1.093
-4.35%
jan 1, 2001
23.792
-0.216
-0.9%
jan 1, 2002
23.566
-0.225
-0.95%
jan 1, 2003
23.354
-0.212
-0.9%
jan 1, 2004
22.879
-0.475
-2.03%
jan 1, 2005
22.353
-0.526
-2.3%
jan 1, 2006
21.885
-0.468
-2.09%
jan 1, 2007
21.08
-0.805
-3.68%
jan 1, 2008
20.093
-0.987
-4.68%
jan 1, 2009
20.515
+0.422
2.1%
jan 1, 2010
19.879
-0.635
-3.1%
jan 1, 2011
19.42
-0.46
-2.31%
jan 1, 2012
19.494
+0.075
0.39%
jan 1, 2013
19.123
-0.371
-1.91%
jan 1, 2014
18.551
-0.572
-2.99%
jan 1, 2015
18.75
+0.199
1.07%
Ranking of countries by current statistics by years


Comments: