30
/
AIzaSyAYiBZKx7MnpbEhh9jyipgxe19OcubqV5w
April 1, 2024
109054
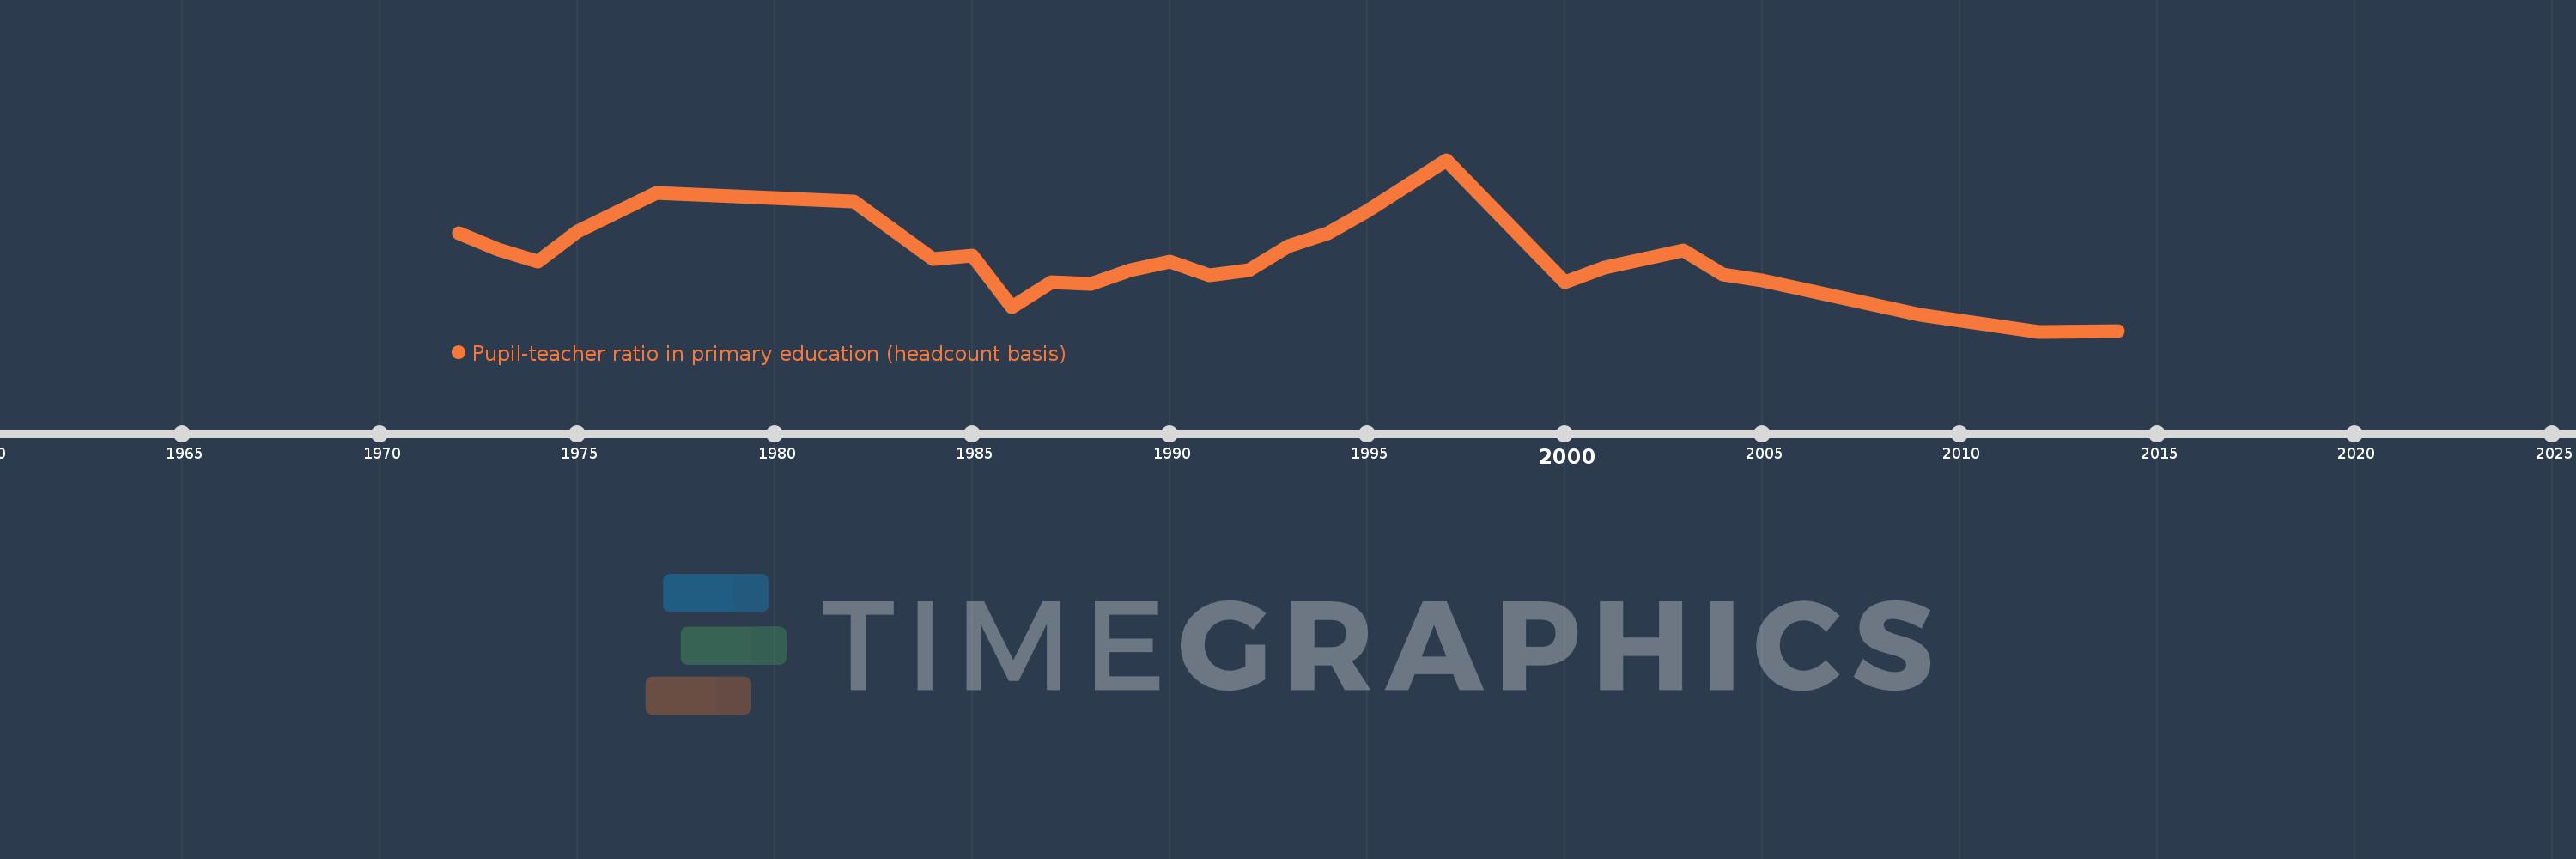
Comoros
COM
true
2
1
Pupil-teacher ratio in primary education (headcount basis)
2014,2012,2009,2005,2004,2003,2001,2000,1997,1995,1994,1993,1992,1991,1990,1989,1988,1987,1986,1985,1984,1982,1977,1975,1974,1973,1972
