29
/
en
AIzaSyAYiBZKx7MnpbEhh9jyipgxe19OcubqV5w
April 1, 2024
209715
New Zealand
NZL
true
2
1
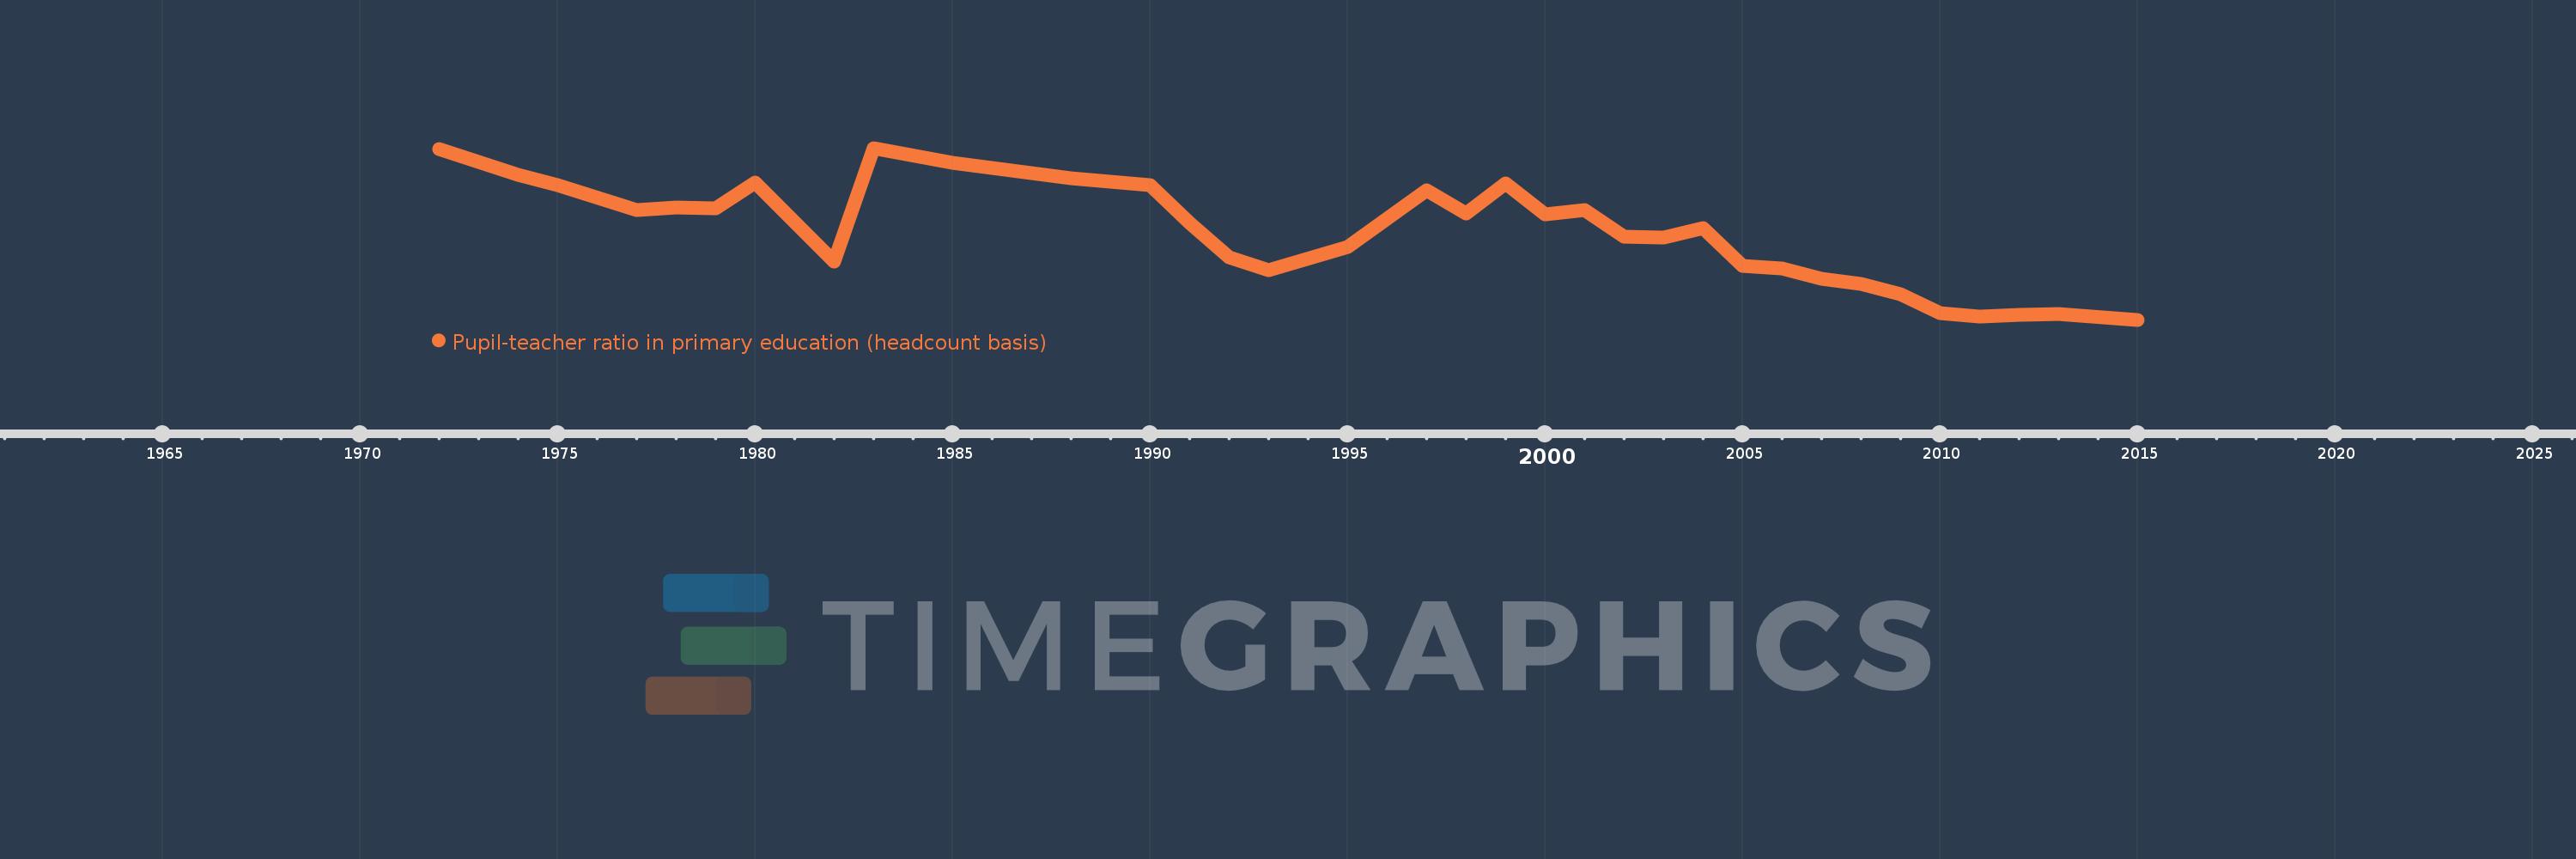
Pupil-teacher ratio in primary education (headcount basis)
2015,2013,2012,2011,2010,2009,2008,2007,2006,2005,2004,2003,2002,2001,2000,1999,1998,1997,1995,1993,1992,1991,1990,1989,1988,1985,1983,1982,1980,1979,1978,1977,1975,1974,1973,1972
This statistics in other country:
AfghanistanAlbaniaAlgeriaAndorraAngolaAntigua and BarbudaArab WorldArgentinaArmeniaArubaAustraliaAustriaAzerbaijanBahamas, TheBahrainBangladeshBarbadosBelarusBelgiumBelizeBeninBermudaBhutanBoliviaBosnia and HerzegovinaBotswanaBrazilBritish Virgin IslandsBrunei DarussalamBulgariaBurkina FasoBurundiCabo VerdeCambodiaCameroonCanadaCaribbean small statesCayman IslandsCentral African RepublicCentral Europe and the BalticsChadChileChinaColombiaComorosCongo, Dem. Rep.Congo, Rep.Costa RicaCote d'IvoireCroatiaCubaCyprusCzech RepublicDenmarkDjiboutiDominicaDominican RepublicEarly-demographic dividendEast Asia & PacificEast Asia & Pacific (excluding high income)East Asia & Pacific (IDA & IBRD countries)EcuadorEgypt, Arab Rep.El SalvadorEquatorial GuineaEritreaEstoniaEthiopiaEuro areaEurope & Central AsiaEurope & Central Asia (excluding high income)Europe & Central Asia (IDA & IBRD countries)European UnionFijiFinlandFragile and conflict affected situationsFranceGabonGambia, TheGeorgiaGermanyGhanaGibraltarGreeceGrenadaGuatemalaGuineaGuinea-BissauGuyanaHaitiHeavily indebted poor countries (HIPC)High incomeHondurasHong Kong SAR, ChinaHungaryIBRD onlyIcelandIDA & IBRD totalIDA blendIDA onlyIDA totalIndiaIndonesiaIran, Islamic Rep.IraqIrelandIsraelItalyJamaicaJapanJordanKazakhstanKenyaKiribatiKorea, Dem. People’s Rep.Korea, Rep.KuwaitKyrgyz RepublicLao PDRLate-demographic dividendLatin America & Caribbean Latin America & Caribbean (excluding high income)Latin America & the Caribbean (IDA & IBRD countries)LatviaLeast developed countries: UN classificationLebanonLesothoLiberiaLibyaLiechtensteinLithuaniaLow & middle incomeLow incomeLower middle incomeLuxembourgMacao SAR, ChinaMacedonia, FYRMadagascarMalawiMalaysiaMaldivesMaliMaltaMarshall IslandsMauritaniaMauritiusMexicoMicronesia, Fed. Sts.Middle East & North AfricaMiddle East & North Africa (excluding high income)Middle East & North Africa (IDA & IBRD countries)Middle incomeMoldovaMonacoMongoliaMoroccoMozambiqueMyanmarNamibiaNauruNepalNetherlandsNew ZealandNicaraguaNigerNigeriaNorth AmericaNorwayOECD membersOmanOther small statesPacific island small statesPakistanPalauPanamaPapua New GuineaParaguayPeruPhilippinesPolandPortugalPost-demographic dividendPre-demographic dividendPuerto RicoQatarRomaniaRussian FederationRwandaSamoaSan MarinoSao Tome and PrincipeSaudi ArabiaSenegalSerbiaSeychellesSierra LeoneSingaporeSint Maarten (Dutch part)Slovak RepublicSloveniaSmall statesSolomon IslandsSomaliaSouth AfricaSouth AsiaSouth Asia (IDA & IBRD)South SudanSpainSri LankaSt. Kitts and NevisSt. LuciaSt. Vincent and the GrenadinesSub-Saharan Africa Sub-Saharan Africa (excluding high income)Sub-Saharan Africa (IDA & IBRD countries)SudanSurinameSwazilandSwedenSwitzerlandSyrian Arab RepublicTajikistanTanzaniaThailandTimor-LesteTogoTongaTrinidad and TobagoTunisiaTurkeyTurks and Caicos IslandsTuvaluUgandaUkraineUnited Arab EmiratesUnited KingdomUnited StatesUpper middle incomeUruguayUzbekistanVanuatuVenezuela, RBVietnamWest Bank and GazaWorldYemen, Rep.ZambiaZimbabwe Timeline:
This timeline shows a graph from 1972 to 2015 of New Zealand. No data until 1971. Number of actual observations by date: 36.
Source name:
World Development Indicators
Source organization:
UNESCO Institute for Statistics
Categories, topics:
Education
Last updated:
apr 23, 2017
Indicators value changes by year
Minimum:
14.367
jan 1, 2015
Maximum:
20.745
jan 1, 1983
At the date of observation
Value
Absolute change
Change from previous value
jan 1, 1972
20.711
+20.711
0.0%
jan 1, 1973
20.216
-0.494
-2.39%
jan 1, 1974
19.74
-0.476
-2.36%
jan 1, 1975
19.367
-0.374
-1.89%
jan 1, 1977
18.45
-0.917
-4.73%
jan 1, 1978
18.525
+0.075
0.41%
jan 1, 1979
18.499
-0.025
-0.14%
jan 1, 1980
19.45
+0.95
5.14%
jan 1, 1982
16.519
-2.931
-15.07%
jan 1, 1983
20.745
+4.226
25.58%
jan 1, 1985
20.203
-0.542
-2.61%
jan 1, 1988
19.634
-0.569
-2.81%
jan 1, 1989
19.493
-0.142
-0.72%
jan 1, 1990
19.362
-0.131
-0.67%
jan 1, 1991
17.969
-1.393
-7.2%
jan 1, 1992
16.672
-1.296
-7.21%
jan 1, 1993
16.202
-0.47
-2.82%
jan 1, 1995
17.058
+0.856
5.28%
jan 1, 1997
19.183
+2.125
12.46%
jan 1, 1998
18.315
-0.868
-4.52%
jan 1, 1999
19.428
+1.113
6.08%
jan 1, 2000
18.269
-1.159
-5.96%
jan 1, 2001
18.448
+0.179
0.98%
jan 1, 2002
17.455
-0.993
-5.38%
jan 1, 2003
17.405
-0.05
-0.29%
jan 1, 2004
17.775
+0.37
2.12%
jan 1, 2005
16.374
-1.401
-7.88%
jan 1, 2006
16.274
-0.1
-0.61%
jan 1, 2007
15.886
-0.388
-2.39%
jan 1, 2008
15.684
-0.202
-1.27%
jan 1, 2009
15.317
-0.367
-2.34%
jan 1, 2010
14.608
-0.709
-4.63%
jan 1, 2011
14.488
-0.12
-0.82%
jan 1, 2012
14.55
+0.062
0.43%
jan 1, 2013
14.587
+0.037
0.25%
jan 1, 2015
14.367
-0.22
-1.51%
Ranking of countries by current statistics by years


Comments: