30
/
AIzaSyAYiBZKx7MnpbEhh9jyipgxe19OcubqV5w
April 1, 2024
230368
Russian Federation
RUS
true
2
1
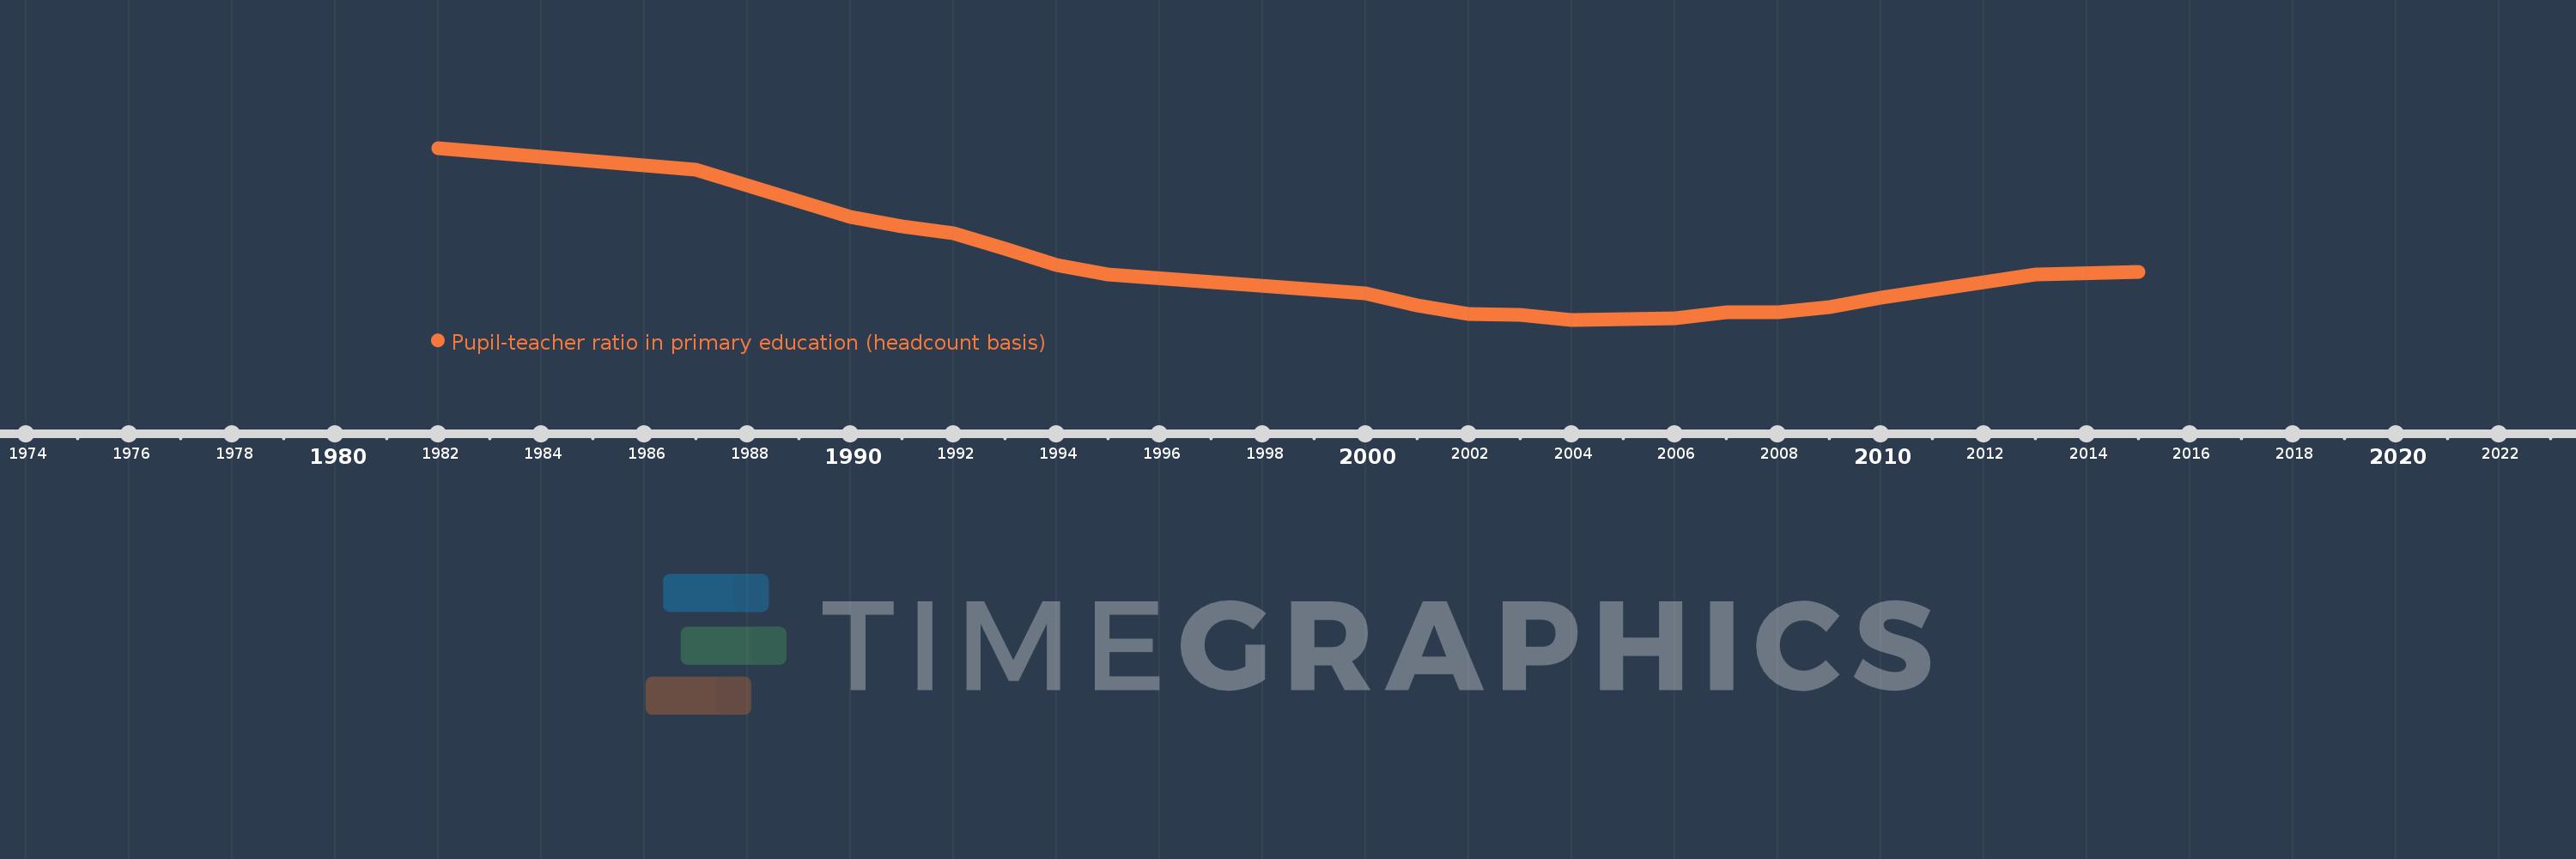
Pupil-teacher ratio in primary education (headcount basis)
2015,2013,2010,2009,2008,2007,2006,2004,2003,2002,2001,2000,1995,1994,1993,1992,1991,1990,1987,1982
