29
/
en
AIzaSyAYiBZKx7MnpbEhh9jyipgxe19OcubqV5w
April 1, 2024
251329
St. Lucia
LCA
true
2
1
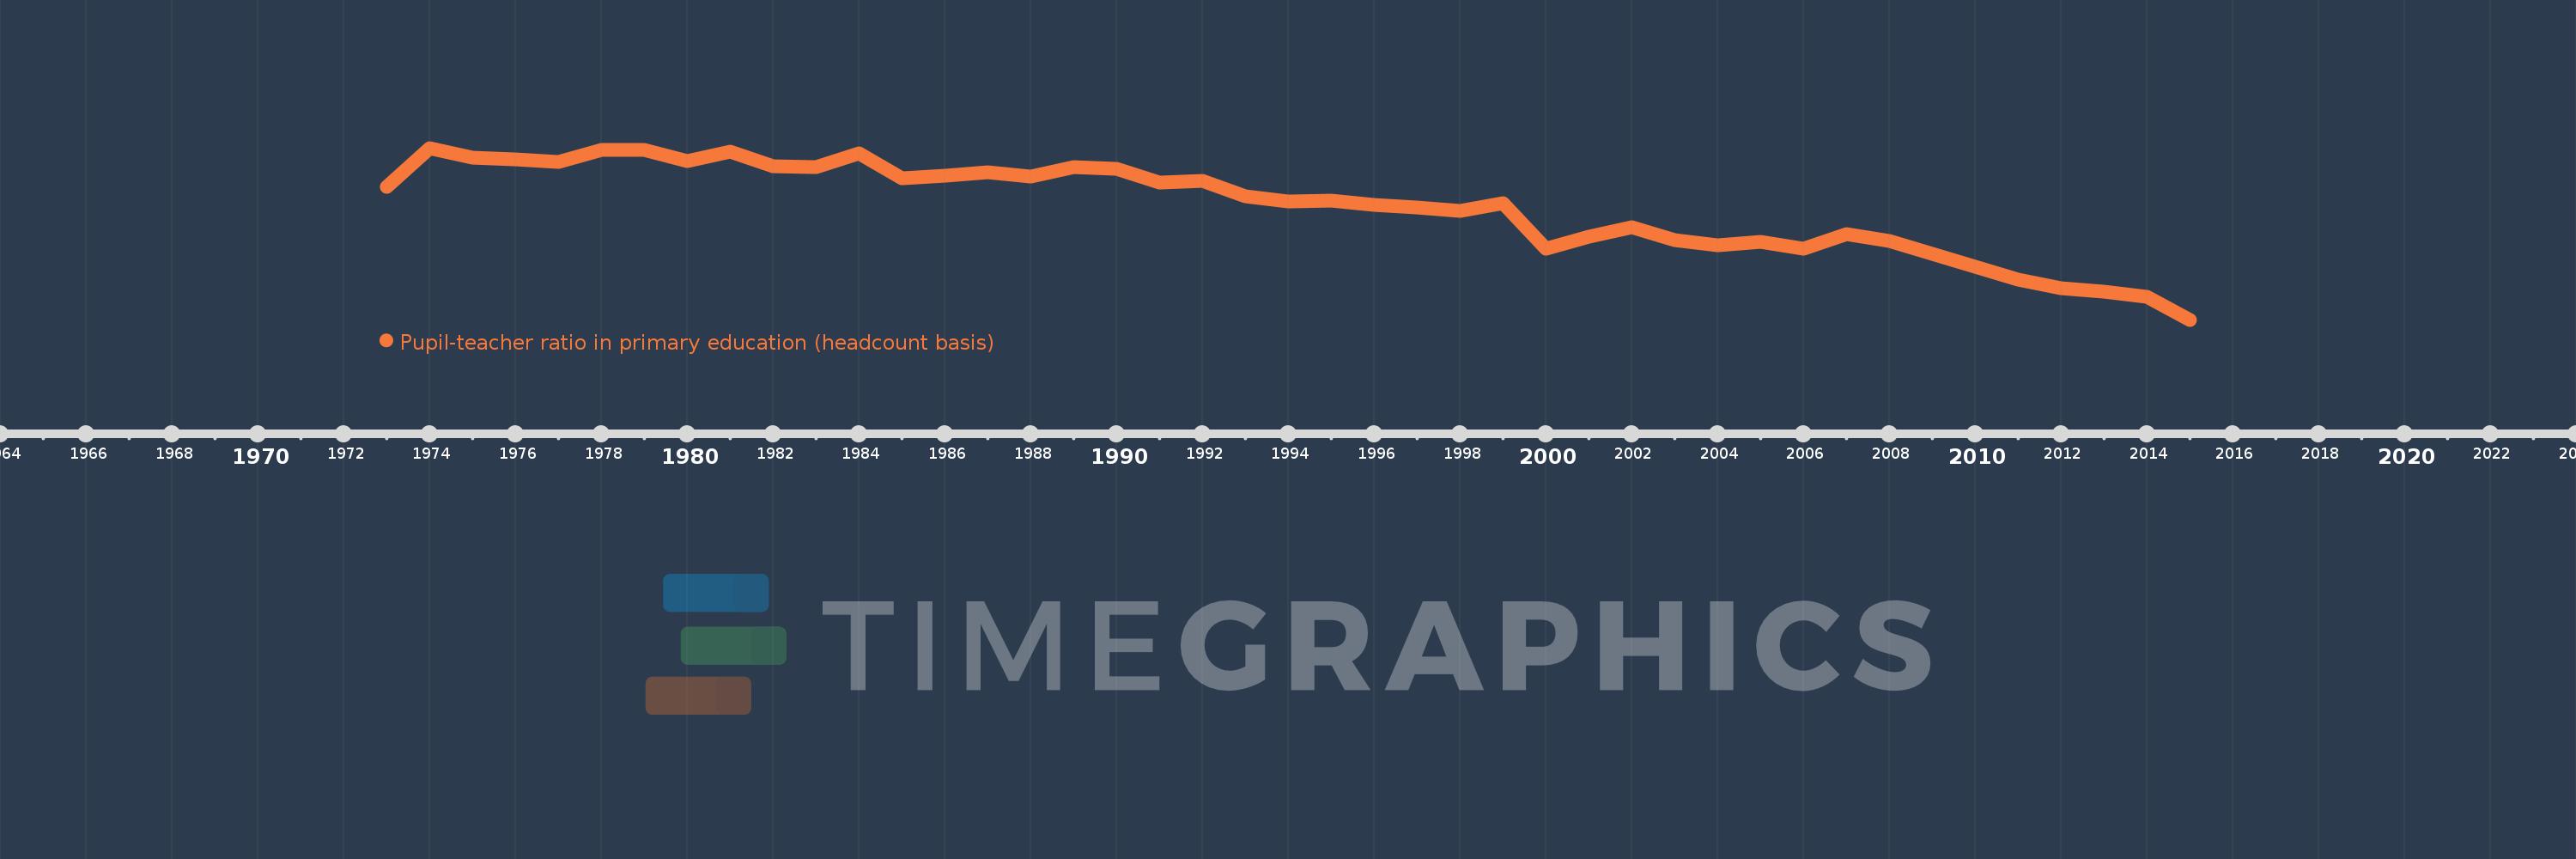
Pupil-teacher ratio in primary education (headcount basis)
2015,2014,2013,2012,2011,2010,2009,2008,2007,2006,2005,2004,2003,2002,2001,2000,1999,1998,1997,1996,1995,1994,1993,1992,1991,1990,1989,1988,1987,1986,1985,1984,1983,1982,1981,1980,1979,1978,1977,1976,1975,1974,1973
This statistics in other country:
AfghanistanAlbaniaAlgeriaAndorraAngolaAntigua and BarbudaArab WorldArgentinaArmeniaArubaAustraliaAustriaAzerbaijanBahamas, TheBahrainBangladeshBarbadosBelarusBelgiumBelizeBeninBermudaBhutanBoliviaBosnia and HerzegovinaBotswanaBrazilBritish Virgin IslandsBrunei DarussalamBulgariaBurkina FasoBurundiCabo VerdeCambodiaCameroonCanadaCaribbean small statesCayman IslandsCentral African RepublicCentral Europe and the BalticsChadChileChinaColombiaComorosCongo, Dem. Rep.Congo, Rep.Costa RicaCote d'IvoireCroatiaCubaCyprusCzech RepublicDenmarkDjiboutiDominicaDominican RepublicEarly-demographic dividendEast Asia & PacificEast Asia & Pacific (excluding high income)East Asia & Pacific (IDA & IBRD countries)EcuadorEgypt, Arab Rep.El SalvadorEquatorial GuineaEritreaEstoniaEthiopiaEuro areaEurope & Central AsiaEurope & Central Asia (excluding high income)Europe & Central Asia (IDA & IBRD countries)European UnionFijiFinlandFragile and conflict affected situationsFranceGabonGambia, TheGeorgiaGermanyGhanaGibraltarGreeceGrenadaGuatemalaGuineaGuinea-BissauGuyanaHaitiHeavily indebted poor countries (HIPC)High incomeHondurasHong Kong SAR, ChinaHungaryIBRD onlyIcelandIDA & IBRD totalIDA blendIDA onlyIDA totalIndiaIndonesiaIran, Islamic Rep.IraqIrelandIsraelItalyJamaicaJapanJordanKazakhstanKenyaKiribatiKorea, Dem. People’s Rep.Korea, Rep.KuwaitKyrgyz RepublicLao PDRLate-demographic dividendLatin America & Caribbean Latin America & Caribbean (excluding high income)Latin America & the Caribbean (IDA & IBRD countries)LatviaLeast developed countries: UN classificationLebanonLesothoLiberiaLibyaLiechtensteinLithuaniaLow & middle incomeLow incomeLower middle incomeLuxembourgMacao SAR, ChinaMacedonia, FYRMadagascarMalawiMalaysiaMaldivesMaliMaltaMarshall IslandsMauritaniaMauritiusMexicoMicronesia, Fed. Sts.Middle East & North AfricaMiddle East & North Africa (excluding high income)Middle East & North Africa (IDA & IBRD countries)Middle incomeMoldovaMonacoMongoliaMoroccoMozambiqueMyanmarNamibiaNauruNepalNetherlandsNew ZealandNicaraguaNigerNigeriaNorth AmericaNorwayOECD membersOmanOther small statesPacific island small statesPakistanPalauPanamaPapua New GuineaParaguayPeruPhilippinesPolandPortugalPost-demographic dividendPre-demographic dividendPuerto RicoQatarRomaniaRussian FederationRwandaSamoaSan MarinoSao Tome and PrincipeSaudi ArabiaSenegalSerbiaSeychellesSierra LeoneSingaporeSint Maarten (Dutch part)Slovak RepublicSloveniaSmall statesSolomon IslandsSomaliaSouth AfricaSouth AsiaSouth Asia (IDA & IBRD)South SudanSpainSri LankaSt. Kitts and NevisSt. LuciaSt. Vincent and the GrenadinesSub-Saharan Africa Sub-Saharan Africa (excluding high income)Sub-Saharan Africa (IDA & IBRD countries)SudanSurinameSwazilandSwedenSwitzerlandSyrian Arab RepublicTajikistanTanzaniaThailandTimor-LesteTogoTongaTrinidad and TobagoTunisiaTurkeyTurks and Caicos IslandsTuvaluUgandaUkraineUnited Arab EmiratesUnited KingdomUnited StatesUpper middle incomeUruguayUzbekistanVanuatuVenezuela, RBVietnamWest Bank and GazaWorldYemen, Rep.ZambiaZimbabwe Timeline:
This timeline shows a graph from 1973 to 2015 of St. Lucia. No data until 1972. Number of actual observations by date: 43.
Source name:
World Development Indicators
Source organization:
UNESCO Institute for Statistics
Categories, topics:
Education
Last updated:
apr 23, 2017
Indicators value changes by year
Minimum:
14.215
jan 1, 2015
Maximum:
32.878
jan 1, 1974
At the date of observation
Value
Absolute change
Change from previous value
jan 1, 1973
28.637
+28.637
0.0%
jan 1, 1974
32.878
+4.241
14.81%
jan 1, 1975
31.863
-1.015
-3.09%
jan 1, 1976
31.654
-0.209
-0.66%
jan 1, 1977
31.332
-0.322
-1.02%
jan 1, 1978
32.628
+1.297
4.14%
jan 1, 1979
32.624
-0.004
-0.01%
jan 1, 1980
31.472
-1.152
-3.53%
jan 1, 1981
32.495
+1.022
3.25%
jan 1, 1982
30.935
-1.559
-4.8%
jan 1, 1983
30.829
-0.106
-0.34%
jan 1, 1984
32.279
+1.45
4.7%
jan 1, 1985
29.619
-2.66
-8.24%
jan 1, 1986
29.839
+0.22
0.74%
jan 1, 1987
30.274
+0.435
1.46%
jan 1, 1988
29.735
-0.539
-1.78%
jan 1, 1989
30.778
+1.042
3.51%
jan 1, 1990
30.61
-0.168
-0.54%
jan 1, 1991
29.154
-1.456
-4.76%
jan 1, 1992
29.287
+0.133
0.46%
jan 1, 1993
27.622
-1.664
-5.68%
jan 1, 1994
27.031
-0.592
-2.14%
jan 1, 1995
27.196
+0.165
0.61%
jan 1, 1996
26.695
-0.501
-1.84%
jan 1, 1997
26.436
-0.26
-0.97%
jan 1, 1998
26.042
-0.394
-1.49%
jan 1, 1999
26.849
+0.807
3.1%
jan 1, 2000
21.902
-4.948
-18.43%
jan 1, 2001
23.233
+1.331
6.08%
jan 1, 2002
24.221
+0.989
4.26%
jan 1, 2003
22.873
-1.349
-5.57%
jan 1, 2004
22.278
-0.594
-2.6%
jan 1, 2005
22.687
+0.408
1.83%
jan 1, 2006
21.969
-0.717
-3.16%
jan 1, 2007
23.528
+1.559
7.1%
jan 1, 2008
22.733
-0.796
-3.38%
jan 1, 2009
21.409
-1.324
-5.82%
jan 1, 2010
19.967
-1.442
-6.73%
jan 1, 2011
18.538
-1.43
-7.16%
jan 1, 2012
17.641
-0.896
-4.83%
jan 1, 2013
17.241
-0.4
-2.27%
jan 1, 2014
16.665
-0.576
-3.34%
jan 1, 2015
14.215
-2.449
-14.7%
Ranking of countries by current statistics by years


Comments: