29
/
en
AIzaSyAYiBZKx7MnpbEhh9jyipgxe19OcubqV5w
April 1, 2024
47673
Lower middle income
LMC
false
2
1
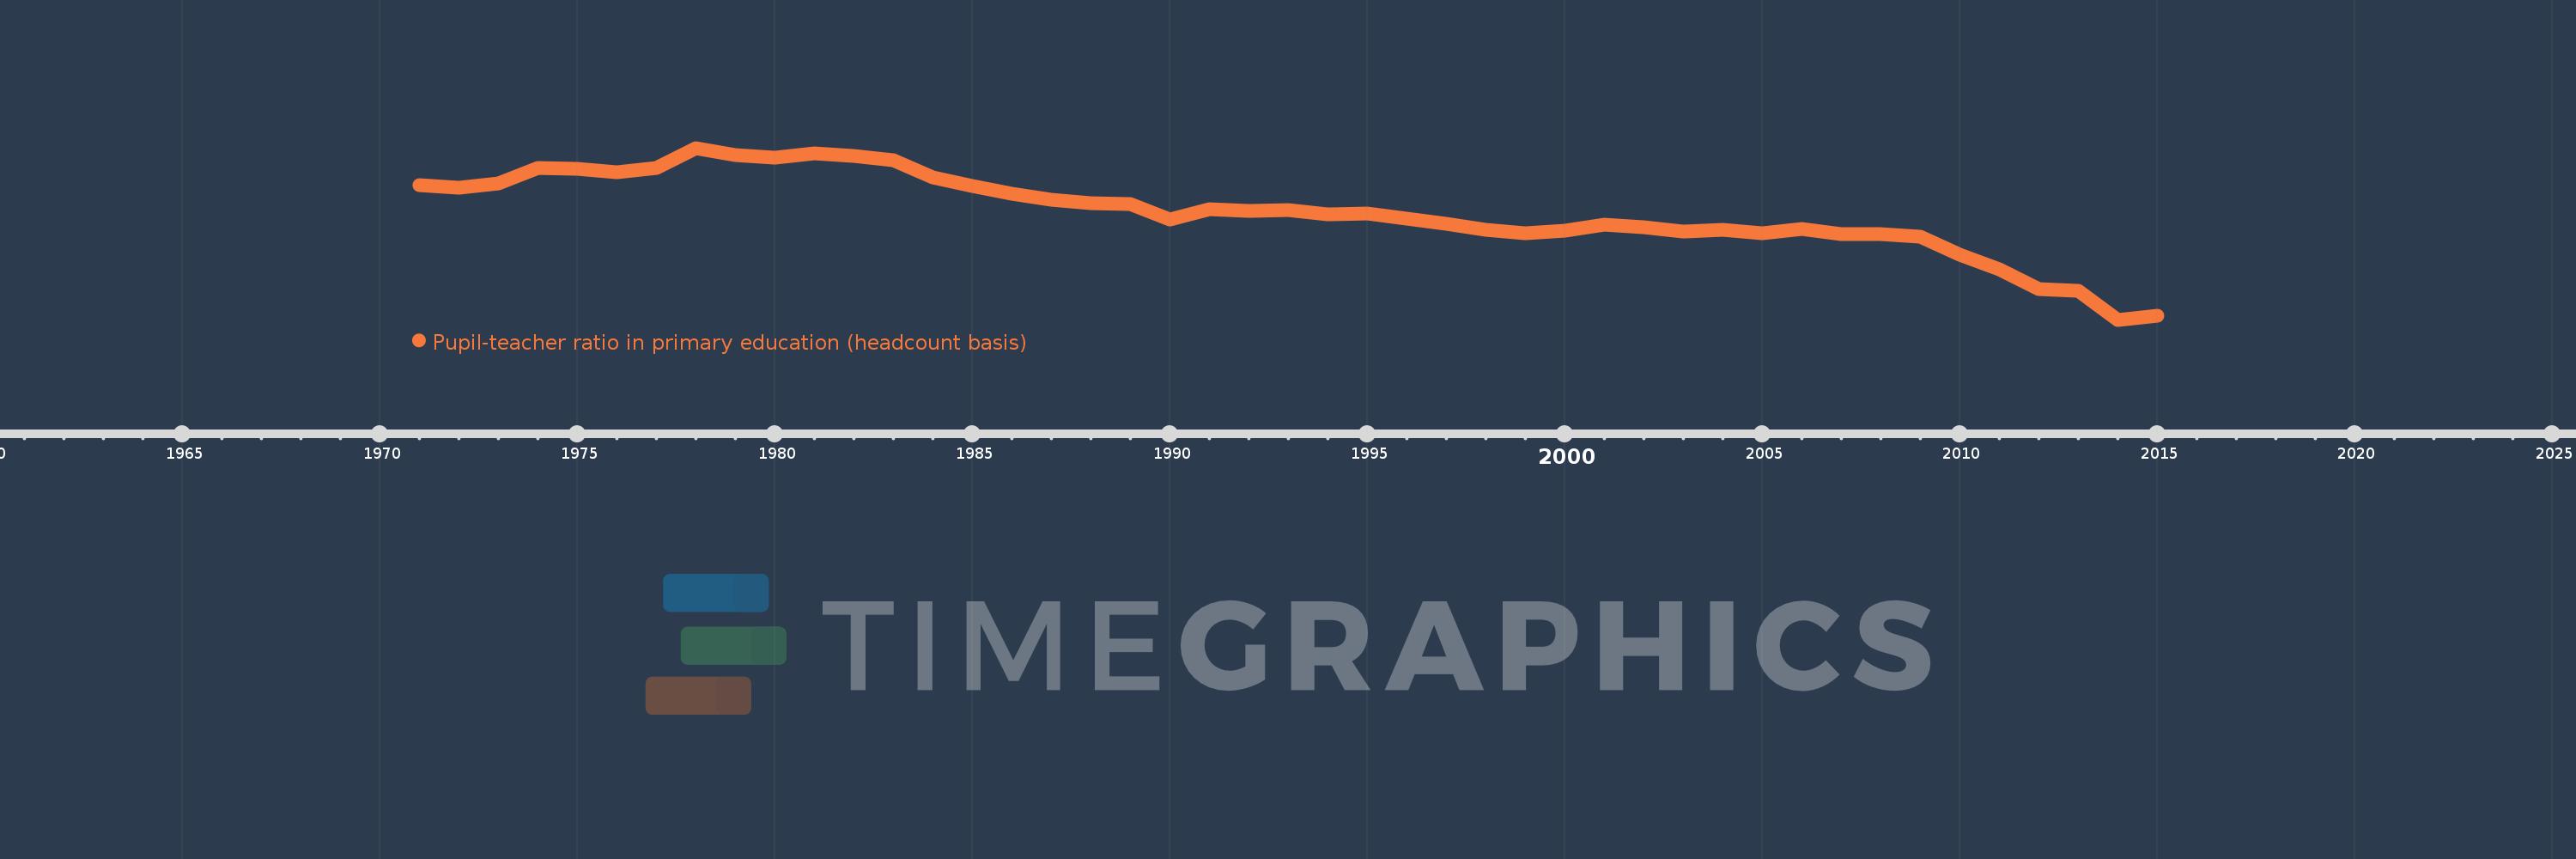
Pupil-teacher ratio in primary education (headcount basis)
2015,2014,2013,2012,2011,2010,2009,2008,2007,2006,2005,2004,2003,2002,2001,2000,1999,1998,1997,1996,1995,1994,1993,1992,1991,1990,1989,1988,1987,1986,1985,1984,1983,1982,1981,1980,1979,1978,1977,1976,1975,1974,1973,1972,1971
This statistics in other country:
AfghanistanAlbaniaAlgeriaAndorraAngolaAntigua and BarbudaArab WorldArgentinaArmeniaArubaAustraliaAustriaAzerbaijanBahamas, TheBahrainBangladeshBarbadosBelarusBelgiumBelizeBeninBermudaBhutanBoliviaBosnia and HerzegovinaBotswanaBrazilBritish Virgin IslandsBrunei DarussalamBulgariaBurkina FasoBurundiCabo VerdeCambodiaCameroonCanadaCaribbean small statesCayman IslandsCentral African RepublicCentral Europe and the BalticsChadChileChinaColombiaComorosCongo, Dem. Rep.Congo, Rep.Costa RicaCote d'IvoireCroatiaCubaCyprusCzech RepublicDenmarkDjiboutiDominicaDominican RepublicEarly-demographic dividendEast Asia & PacificEast Asia & Pacific (excluding high income)East Asia & Pacific (IDA & IBRD countries)EcuadorEgypt, Arab Rep.El SalvadorEquatorial GuineaEritreaEstoniaEthiopiaEuro areaEurope & Central AsiaEurope & Central Asia (excluding high income)Europe & Central Asia (IDA & IBRD countries)European UnionFijiFinlandFragile and conflict affected situationsFranceGabonGambia, TheGeorgiaGermanyGhanaGibraltarGreeceGrenadaGuatemalaGuineaGuinea-BissauGuyanaHaitiHeavily indebted poor countries (HIPC)High incomeHondurasHong Kong SAR, ChinaHungaryIBRD onlyIcelandIDA & IBRD totalIDA blendIDA onlyIDA totalIndiaIndonesiaIran, Islamic Rep.IraqIrelandIsraelItalyJamaicaJapanJordanKazakhstanKenyaKiribatiKorea, Dem. People’s Rep.Korea, Rep.KuwaitKyrgyz RepublicLao PDRLate-demographic dividendLatin America & Caribbean Latin America & Caribbean (excluding high income)Latin America & the Caribbean (IDA & IBRD countries)LatviaLeast developed countries: UN classificationLebanonLesothoLiberiaLibyaLiechtensteinLithuaniaLow & middle incomeLow incomeLower middle incomeLuxembourgMacao SAR, ChinaMacedonia, FYRMadagascarMalawiMalaysiaMaldivesMaliMaltaMarshall IslandsMauritaniaMauritiusMexicoMicronesia, Fed. Sts.Middle East & North AfricaMiddle East & North Africa (excluding high income)Middle East & North Africa (IDA & IBRD countries)Middle incomeMoldovaMonacoMongoliaMoroccoMozambiqueMyanmarNamibiaNauruNepalNetherlandsNew ZealandNicaraguaNigerNigeriaNorth AmericaNorwayOECD membersOmanOther small statesPacific island small statesPakistanPalauPanamaPapua New GuineaParaguayPeruPhilippinesPolandPortugalPost-demographic dividendPre-demographic dividendPuerto RicoQatarRomaniaRussian FederationRwandaSamoaSan MarinoSao Tome and PrincipeSaudi ArabiaSenegalSerbiaSeychellesSierra LeoneSingaporeSint Maarten (Dutch part)Slovak RepublicSloveniaSmall statesSolomon IslandsSomaliaSouth AfricaSouth AsiaSouth Asia (IDA & IBRD)South SudanSpainSri LankaSt. Kitts and NevisSt. LuciaSt. Vincent and the GrenadinesSub-Saharan Africa Sub-Saharan Africa (excluding high income)Sub-Saharan Africa (IDA & IBRD countries)SudanSurinameSwazilandSwedenSwitzerlandSyrian Arab RepublicTajikistanTanzaniaThailandTimor-LesteTogoTongaTrinidad and TobagoTunisiaTurkeyTurks and Caicos IslandsTuvaluUgandaUkraineUnited Arab EmiratesUnited KingdomUnited StatesUpper middle incomeUruguayUzbekistanVanuatuVenezuela, RBVietnamWest Bank and GazaWorldYemen, Rep.ZambiaZimbabwe Timeline:
This timeline shows a graph from 1971 to 2015 of Lower middle income. No data until 1970. Number of actual observations by date: 45.
Source name:
World Development Indicators
Source organization:
UNESCO Institute for Statistics
Categories, topics:
Education
Last updated:
apr 23, 2017
Indicators value changes by year
Minimum:
29.166
jan 1, 2014
Maximum:
37.752
jan 1, 1978
At the date of observation
Value
Absolute change
Change from previous value
jan 1, 1971
35.877
+35.877
0.0%
jan 1, 1972
35.753
-0.123
-0.34%
jan 1, 1973
35.988
+0.235
0.66%
jan 1, 1974
36.761
+0.773
2.15%
jan 1, 1975
36.713
-0.048
-0.13%
jan 1, 1976
36.545
-0.168
-0.46%
jan 1, 1977
36.732
+0.186
0.51%
jan 1, 1978
37.752
+1.02
2.78%
jan 1, 1979
37.387
-0.364
-0.97%
jan 1, 1980
37.287
-0.1
-0.27%
jan 1, 1981
37.498
+0.211
0.56%
jan 1, 1982
37.342
-0.155
-0.41%
jan 1, 1983
37.142
-0.2
-0.54%
jan 1, 1984
36.289
-0.853
-2.3%
jan 1, 1985
35.834
-0.454
-1.25%
jan 1, 1986
35.455
-0.38
-1.06%
jan 1, 1987
35.156
-0.299
-0.84%
jan 1, 1988
35.004
-0.152
-0.43%
jan 1, 1989
34.961
-0.044
-0.12%
jan 1, 1990
34.171
-0.79
-2.26%
jan 1, 1991
34.693
+0.522
1.53%
jan 1, 1992
34.616
-0.077
-0.22%
jan 1, 1993
34.63
+0.014
0.04%
jan 1, 1994
34.45
-0.18
-0.52%
jan 1, 1995
34.457
+0.007
0.02%
jan 1, 1996
34.235
-0.222
-0.65%
jan 1, 1997
33.946
-0.289
-0.84%
jan 1, 1998
33.646
-0.3
-0.89%
jan 1, 1999
33.483
-0.162
-0.48%
jan 1, 2000
33.603
+0.12
0.36%
jan 1, 2001
33.926
+0.322
0.96%
jan 1, 2002
33.772
-0.153
-0.45%
jan 1, 2003
33.57
-0.202
-0.6%
jan 1, 2004
33.658
+0.088
0.26%
jan 1, 2005
33.47
-0.187
-0.56%
jan 1, 2006
33.686
+0.216
0.65%
jan 1, 2007
33.46
-0.227
-0.67%
jan 1, 2008
33.442
-0.017
-0.05%
jan 1, 2009
33.296
-0.146
-0.44%
jan 1, 2010
32.43
-0.866
-2.6%
jan 1, 2011
31.704
-0.727
-2.24%
jan 1, 2012
30.707
-0.997
-3.14%
jan 1, 2013
30.599
-0.109
-0.35%
jan 1, 2014
29.166
-1.433
-4.68%
jan 1, 2015
29.358
+0.192
0.66%
Ranking of countries by current statistics by years


Comments: