29
/
en
AIzaSyAYiBZKx7MnpbEhh9jyipgxe19OcubqV5w
April 1, 2024
95483
Burkina Faso
BFA
true
2
1
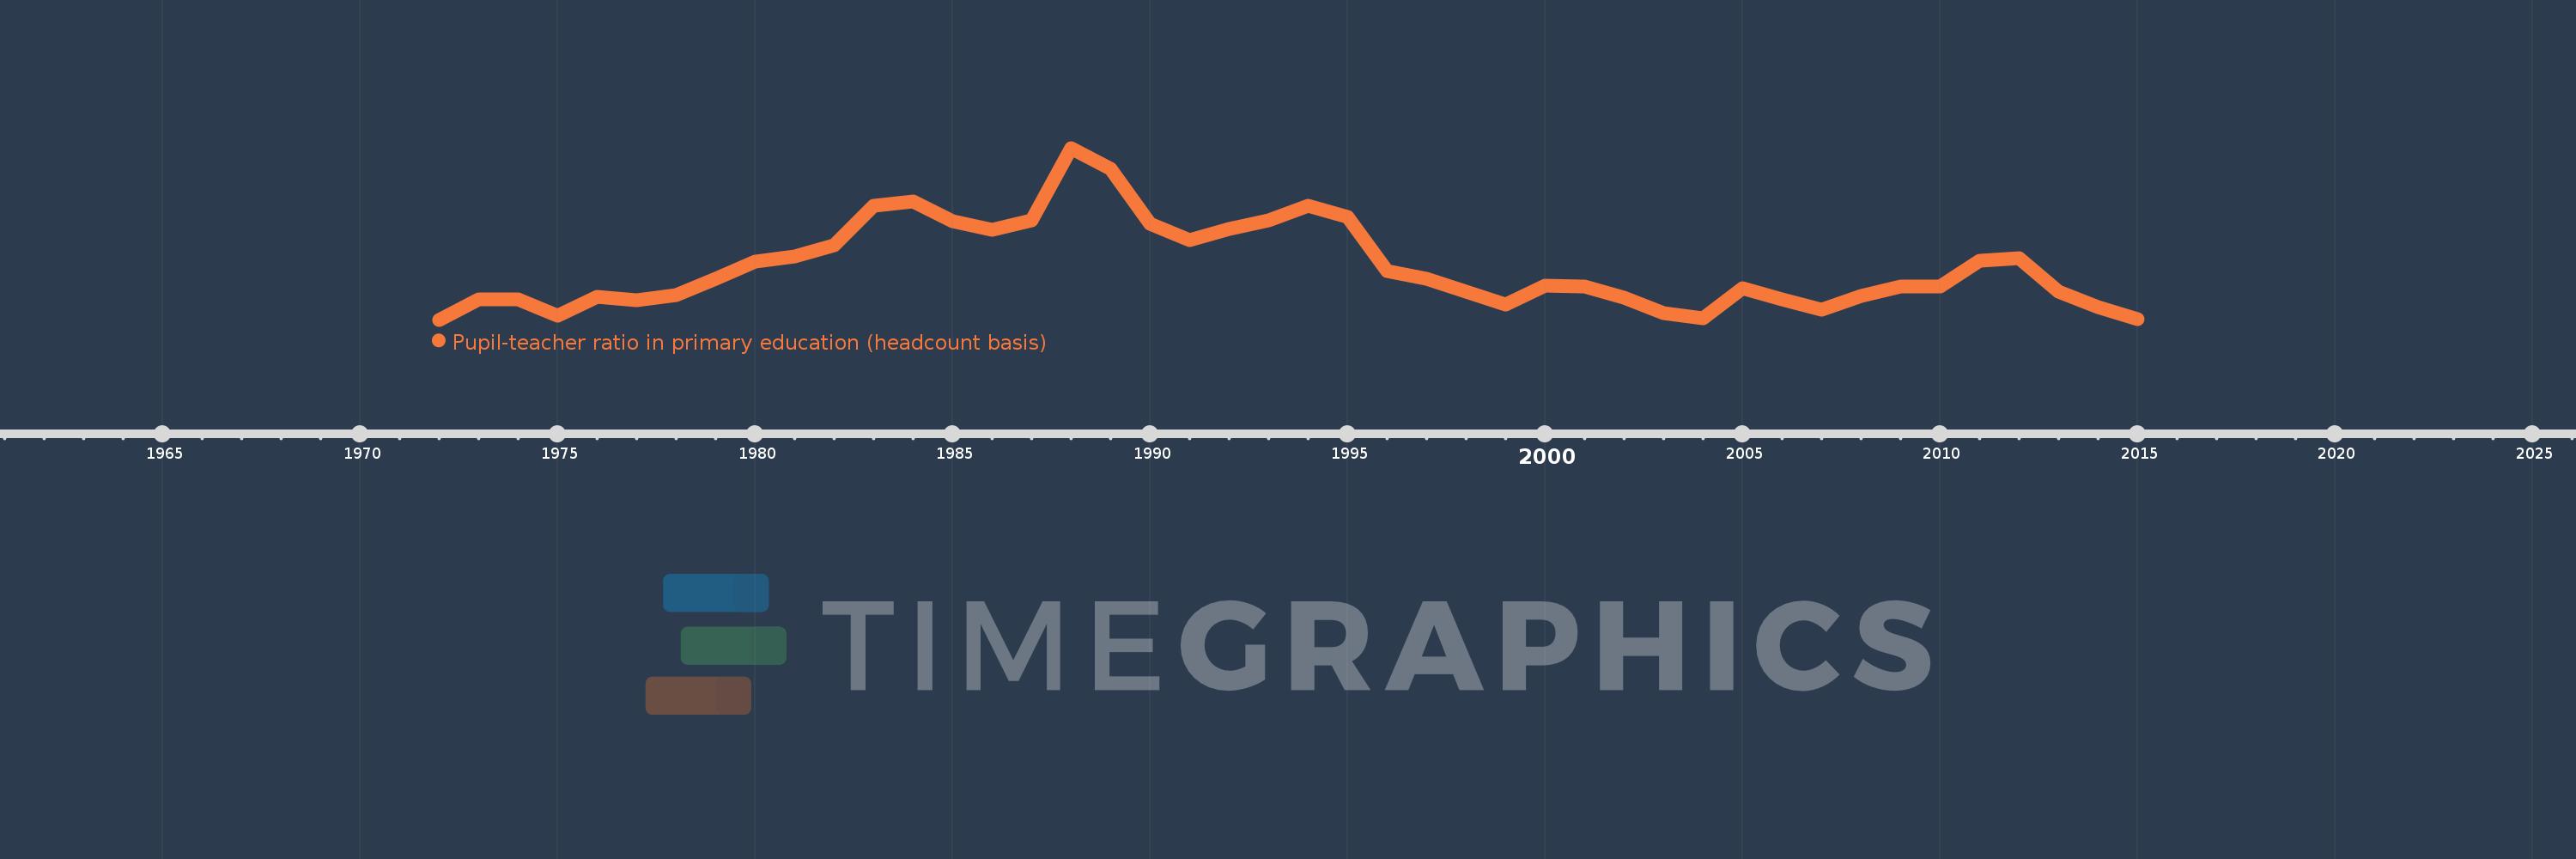
Pupil-teacher ratio in primary education (headcount basis)
2015,2014,2013,2012,2011,2010,2009,2008,2007,2006,2005,2004,2003,2002,2001,2000,1999,1997,1996,1995,1994,1993,1992,1991,1990,1989,1988,1987,1986,1985,1984,1983,1982,1981,1980,1979,1978,1977,1976,1975,1974,1973,1972
This statistics in other country:
AfghanistanAlbaniaAlgeriaAndorraAngolaAntigua and BarbudaArab WorldArgentinaArmeniaArubaAustraliaAustriaAzerbaijanBahamas, TheBahrainBangladeshBarbadosBelarusBelgiumBelizeBeninBermudaBhutanBoliviaBosnia and HerzegovinaBotswanaBrazilBritish Virgin IslandsBrunei DarussalamBulgariaBurkina FasoBurundiCabo VerdeCambodiaCameroonCanadaCaribbean small statesCayman IslandsCentral African RepublicCentral Europe and the BalticsChadChileChinaColombiaComorosCongo, Dem. Rep.Congo, Rep.Costa RicaCote d'IvoireCroatiaCubaCyprusCzech RepublicDenmarkDjiboutiDominicaDominican RepublicEarly-demographic dividendEast Asia & PacificEast Asia & Pacific (excluding high income)East Asia & Pacific (IDA & IBRD countries)EcuadorEgypt, Arab Rep.El SalvadorEquatorial GuineaEritreaEstoniaEthiopiaEuro areaEurope & Central AsiaEurope & Central Asia (excluding high income)Europe & Central Asia (IDA & IBRD countries)European UnionFijiFinlandFragile and conflict affected situationsFranceGabonGambia, TheGeorgiaGermanyGhanaGibraltarGreeceGrenadaGuatemalaGuineaGuinea-BissauGuyanaHaitiHeavily indebted poor countries (HIPC)High incomeHondurasHong Kong SAR, ChinaHungaryIBRD onlyIcelandIDA & IBRD totalIDA blendIDA onlyIDA totalIndiaIndonesiaIran, Islamic Rep.IraqIrelandIsraelItalyJamaicaJapanJordanKazakhstanKenyaKiribatiKorea, Dem. People’s Rep.Korea, Rep.KuwaitKyrgyz RepublicLao PDRLate-demographic dividendLatin America & Caribbean Latin America & Caribbean (excluding high income)Latin America & the Caribbean (IDA & IBRD countries)LatviaLeast developed countries: UN classificationLebanonLesothoLiberiaLibyaLiechtensteinLithuaniaLow & middle incomeLow incomeLower middle incomeLuxembourgMacao SAR, ChinaMacedonia, FYRMadagascarMalawiMalaysiaMaldivesMaliMaltaMarshall IslandsMauritaniaMauritiusMexicoMicronesia, Fed. Sts.Middle East & North AfricaMiddle East & North Africa (excluding high income)Middle East & North Africa (IDA & IBRD countries)Middle incomeMoldovaMonacoMongoliaMoroccoMozambiqueMyanmarNamibiaNauruNepalNetherlandsNew ZealandNicaraguaNigerNigeriaNorth AmericaNorwayOECD membersOmanOther small statesPacific island small statesPakistanPalauPanamaPapua New GuineaParaguayPeruPhilippinesPolandPortugalPost-demographic dividendPre-demographic dividendPuerto RicoQatarRomaniaRussian FederationRwandaSamoaSan MarinoSao Tome and PrincipeSaudi ArabiaSenegalSerbiaSeychellesSierra LeoneSingaporeSint Maarten (Dutch part)Slovak RepublicSloveniaSmall statesSolomon IslandsSomaliaSouth AfricaSouth AsiaSouth Asia (IDA & IBRD)South SudanSpainSri LankaSt. Kitts and NevisSt. LuciaSt. Vincent and the GrenadinesSub-Saharan Africa Sub-Saharan Africa (excluding high income)Sub-Saharan Africa (IDA & IBRD countries)SudanSurinameSwazilandSwedenSwitzerlandSyrian Arab RepublicTajikistanTanzaniaThailandTimor-LesteTogoTongaTrinidad and TobagoTunisiaTurkeyTurks and Caicos IslandsTuvaluUgandaUkraineUnited Arab EmiratesUnited KingdomUnited StatesUpper middle incomeUruguayUzbekistanVanuatuVenezuela, RBVietnamWest Bank and GazaWorldYemen, Rep.ZambiaZimbabwe Timeline:
This timeline shows a graph from 1972 to 2015 of Burkina Faso. No data until 1971. Number of actual observations by date: 43.
Source name:
World Development Indicators
Source organization:
UNESCO Institute for Statistics
Categories, topics:
Education
Last updated:
apr 23, 2017
Indicators value changes by year
Minimum:
44.452
jan 1, 1972
Maximum:
67.546
jan 1, 1988
At the date of observation
Value
Absolute change
Change from previous value
jan 1, 1972
44.452
+44.452
0.0%
jan 1, 1973
47.158
+2.706
6.09%
jan 1, 1974
47.183
+0.026
0.05%
jan 1, 1975
45.033
-2.151
-4.56%
jan 1, 1976
47.499
+2.466
5.48%
jan 1, 1977
47.106
-0.393
-0.83%
jan 1, 1978
47.782
+0.676
1.43%
jan 1, 1979
49.921
+2.14
4.48%
jan 1, 1980
52.32
+2.399
4.81%
jan 1, 1981
52.96
+0.639
1.22%
jan 1, 1982
54.485
+1.526
2.88%
jan 1, 1983
59.787
+5.302
9.73%
jan 1, 1984
60.349
+0.562
0.94%
jan 1, 1985
57.701
-2.648
-4.39%
jan 1, 1986
56.49
-1.21
-2.1%
jan 1, 1987
57.758
+1.268
2.25%
jan 1, 1988
67.546
+9.787
16.94%
jan 1, 1989
64.775
-2.77
-4.1%
jan 1, 1990
57.359
-7.416
-11.45%
jan 1, 1991
55.177
-2.182
-3.8%
jan 1, 1992
56.657
+1.479
2.68%
jan 1, 1993
57.83
+1.173
2.07%
jan 1, 1994
59.779
+1.949
3.37%
jan 1, 1995
58.256
-1.524
-2.55%
jan 1, 1996
50.98
-7.276
-12.49%
jan 1, 1997
49.939
-1.041
-2.04%
jan 1, 1999
46.501
-3.438
-6.88%
jan 1, 2000
49.003
+2.502
5.38%
jan 1, 2001
48.876
-0.127
-0.26%
jan 1, 2002
47.419
-1.458
-2.98%
jan 1, 2003
45.378
-2.041
-4.3%
jan 1, 2004
44.659
-0.719
-1.58%
jan 1, 2005
48.693
+4.034
9.03%
jan 1, 2006
47.176
-1.517
-3.11%
jan 1, 2007
45.831
-1.345
-2.85%
jan 1, 2008
47.657
+1.826
3.98%
jan 1, 2009
48.922
+1.264
2.65%
jan 1, 2010
48.9
-0.021
-0.04%
jan 1, 2011
52.4
+3.5
7.16%
jan 1, 2012
52.686
+0.287
0.55%
jan 1, 2013
48.239
-4.447
-8.44%
jan 1, 2014
46.096
-2.143
-4.44%
jan 1, 2015
44.499
-1.597
-3.47%
Ranking of countries by current statistics by years


Comments: