29
/
en
AIzaSyAYiBZKx7MnpbEhh9jyipgxe19OcubqV5w
April 1, 2024
62145
Upper middle income
UMC
false
2
1
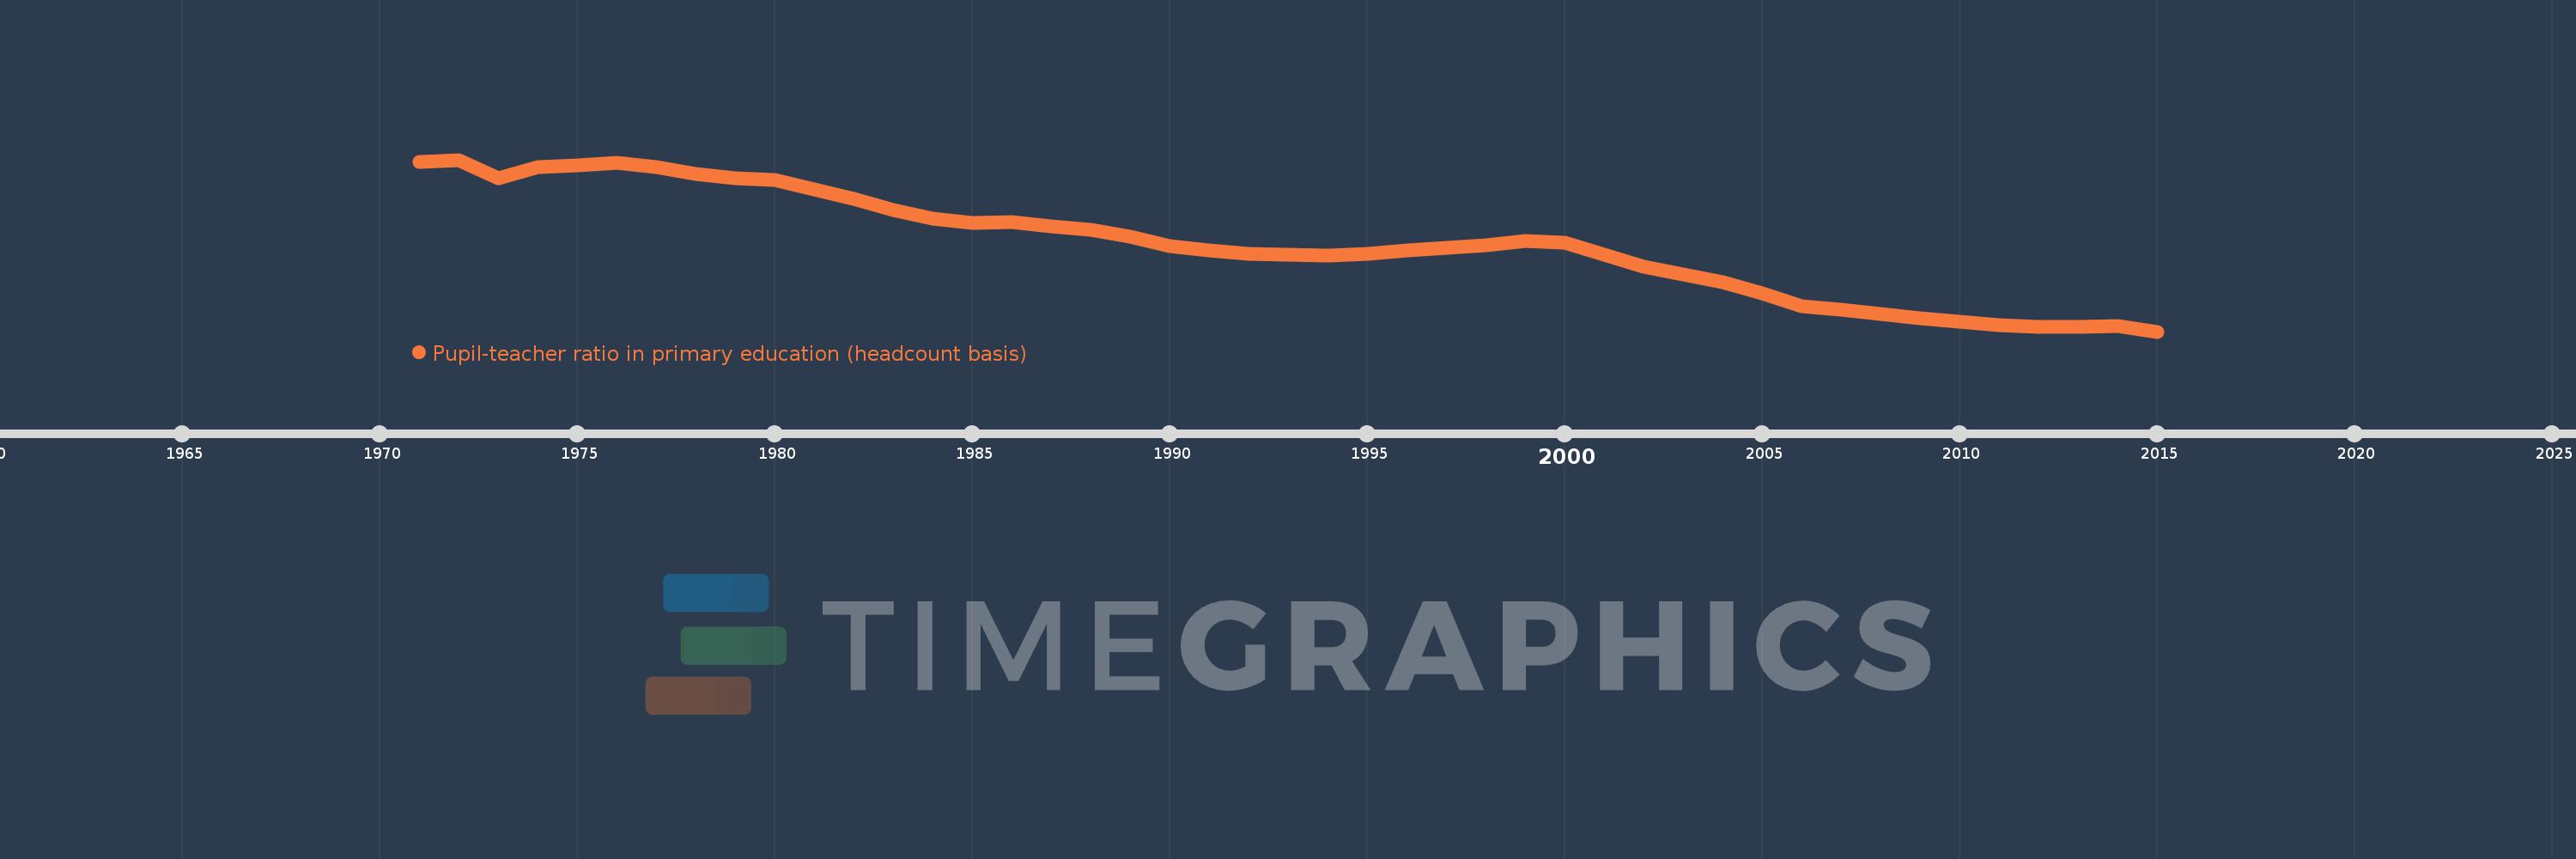
Pupil-teacher ratio in primary education (headcount basis)
2015,2014,2013,2012,2011,2010,2009,2008,2007,2006,2005,2004,2003,2002,2001,2000,1999,1998,1997,1996,1995,1994,1993,1992,1991,1990,1989,1988,1987,1986,1985,1984,1983,1982,1981,1980,1979,1978,1977,1976,1975,1974,1973,1972,1971
This statistics in other country:
AfghanistanAlbaniaAlgeriaAndorraAngolaAntigua and BarbudaArab WorldArgentinaArmeniaArubaAustraliaAustriaAzerbaijanBahamas, TheBahrainBangladeshBarbadosBelarusBelgiumBelizeBeninBermudaBhutanBoliviaBosnia and HerzegovinaBotswanaBrazilBritish Virgin IslandsBrunei DarussalamBulgariaBurkina FasoBurundiCabo VerdeCambodiaCameroonCanadaCaribbean small statesCayman IslandsCentral African RepublicCentral Europe and the BalticsChadChileChinaColombiaComorosCongo, Dem. Rep.Congo, Rep.Costa RicaCote d'IvoireCroatiaCubaCyprusCzech RepublicDenmarkDjiboutiDominicaDominican RepublicEarly-demographic dividendEast Asia & PacificEast Asia & Pacific (excluding high income)East Asia & Pacific (IDA & IBRD countries)EcuadorEgypt, Arab Rep.El SalvadorEquatorial GuineaEritreaEstoniaEthiopiaEuro areaEurope & Central AsiaEurope & Central Asia (excluding high income)Europe & Central Asia (IDA & IBRD countries)European UnionFijiFinlandFragile and conflict affected situationsFranceGabonGambia, TheGeorgiaGermanyGhanaGibraltarGreeceGrenadaGuatemalaGuineaGuinea-BissauGuyanaHaitiHeavily indebted poor countries (HIPC)High incomeHondurasHong Kong SAR, ChinaHungaryIBRD onlyIcelandIDA & IBRD totalIDA blendIDA onlyIDA totalIndiaIndonesiaIran, Islamic Rep.IraqIrelandIsraelItalyJamaicaJapanJordanKazakhstanKenyaKiribatiKorea, Dem. People’s Rep.Korea, Rep.KuwaitKyrgyz RepublicLao PDRLate-demographic dividendLatin America & Caribbean Latin America & Caribbean (excluding high income)Latin America & the Caribbean (IDA & IBRD countries)LatviaLeast developed countries: UN classificationLebanonLesothoLiberiaLibyaLiechtensteinLithuaniaLow & middle incomeLow incomeLower middle incomeLuxembourgMacao SAR, ChinaMacedonia, FYRMadagascarMalawiMalaysiaMaldivesMaliMaltaMarshall IslandsMauritaniaMauritiusMexicoMicronesia, Fed. Sts.Middle East & North AfricaMiddle East & North Africa (excluding high income)Middle East & North Africa (IDA & IBRD countries)Middle incomeMoldovaMonacoMongoliaMoroccoMozambiqueMyanmarNamibiaNauruNepalNetherlandsNew ZealandNicaraguaNigerNigeriaNorth AmericaNorwayOECD membersOmanOther small statesPacific island small statesPakistanPalauPanamaPapua New GuineaParaguayPeruPhilippinesPolandPortugalPost-demographic dividendPre-demographic dividendPuerto RicoQatarRomaniaRussian FederationRwandaSamoaSan MarinoSao Tome and PrincipeSaudi ArabiaSenegalSerbiaSeychellesSierra LeoneSingaporeSint Maarten (Dutch part)Slovak RepublicSloveniaSmall statesSolomon IslandsSomaliaSouth AfricaSouth AsiaSouth Asia (IDA & IBRD)South SudanSpainSri LankaSt. Kitts and NevisSt. LuciaSt. Vincent and the GrenadinesSub-Saharan Africa Sub-Saharan Africa (excluding high income)Sub-Saharan Africa (IDA & IBRD countries)SudanSurinameSwazilandSwedenSwitzerlandSyrian Arab RepublicTajikistanTanzaniaThailandTimor-LesteTogoTongaTrinidad and TobagoTunisiaTurkeyTurks and Caicos IslandsTuvaluUgandaUkraineUnited Arab EmiratesUnited KingdomUnited StatesUpper middle incomeUruguayUzbekistanVanuatuVenezuela, RBVietnamWest Bank and GazaWorldYemen, Rep.ZambiaZimbabwe Timeline:
This timeline shows a graph from 1971 to 2015 of Upper middle income. No data until 1970. Number of actual observations by date: 45.
Source name:
World Development Indicators
Source organization:
UNESCO Institute for Statistics
Categories, topics:
Education
Last updated:
apr 23, 2017
Indicators value changes by year
Minimum:
18.539
jan 1, 2015
Maximum:
29.641
jan 1, 1972
At the date of observation
Value
Absolute change
Change from previous value
jan 1, 1971
29.478
+29.478
0.0%
jan 1, 1972
29.641
+0.163
0.55%
jan 1, 1973
28.462
-1.179
-3.98%
jan 1, 1974
29.145
+0.683
2.4%
jan 1, 1975
29.292
+0.147
0.51%
jan 1, 1976
29.465
+0.173
0.59%
jan 1, 1977
29.151
-0.314
-1.07%
jan 1, 1978
28.74
-0.411
-1.41%
jan 1, 1979
28.456
-0.284
-0.99%
jan 1, 1980
28.348
-0.108
-0.38%
jan 1, 1981
27.732
-0.616
-2.17%
jan 1, 1982
27.143
-0.589
-2.12%
jan 1, 1983
26.404
-0.738
-2.72%
jan 1, 1984
25.858
-0.546
-2.07%
jan 1, 1985
25.584
-0.274
-1.06%
jan 1, 1986
25.614
+0.03
0.12%
jan 1, 1987
25.357
-0.257
-1.0%
jan 1, 1988
25.107
-0.25
-0.99%
jan 1, 1989
24.656
-0.451
-1.8%
jan 1, 1990
24.071
-0.585
-2.37%
jan 1, 1991
23.779
-0.292
-1.21%
jan 1, 1992
23.576
-0.203
-0.85%
jan 1, 1993
23.48
-0.097
-0.41%
jan 1, 1994
23.458
-0.021
-0.09%
jan 1, 1995
23.566
+0.108
0.46%
jan 1, 1996
23.768
+0.202
0.86%
jan 1, 1997
23.932
+0.164
0.69%
jan 1, 1998
24.138
+0.206
0.86%
jan 1, 1999
24.41
+0.271
1.12%
jan 1, 2000
24.265
-0.144
-0.59%
jan 1, 2001
23.506
-0.76
-3.13%
jan 1, 2002
22.737
-0.769
-3.27%
jan 1, 2003
22.254
-0.483
-2.12%
jan 1, 2004
21.734
-0.52
-2.34%
jan 1, 2005
20.983
-0.751
-3.46%
jan 1, 2006
20.18
-0.802
-3.82%
jan 1, 2007
19.963
-0.217
-1.08%
jan 1, 2008
19.665
-0.298
-1.49%
jan 1, 2009
19.42
-0.246
-1.25%
jan 1, 2010
19.157
-0.262
-1.35%
jan 1, 2011
18.929
-0.228
-1.19%
jan 1, 2012
18.853
-0.076
-0.4%
jan 1, 2013
18.82
-0.033
-0.17%
jan 1, 2014
18.915
+0.095
0.5%
jan 1, 2015
18.539
-0.376
-1.99%
Ranking of countries by current statistics by years


Comments: