29
/
en
AIzaSyAYiBZKx7MnpbEhh9jyipgxe19OcubqV5w
April 1, 2024
27662
East Asia & Pacific
EAS
false
2
1
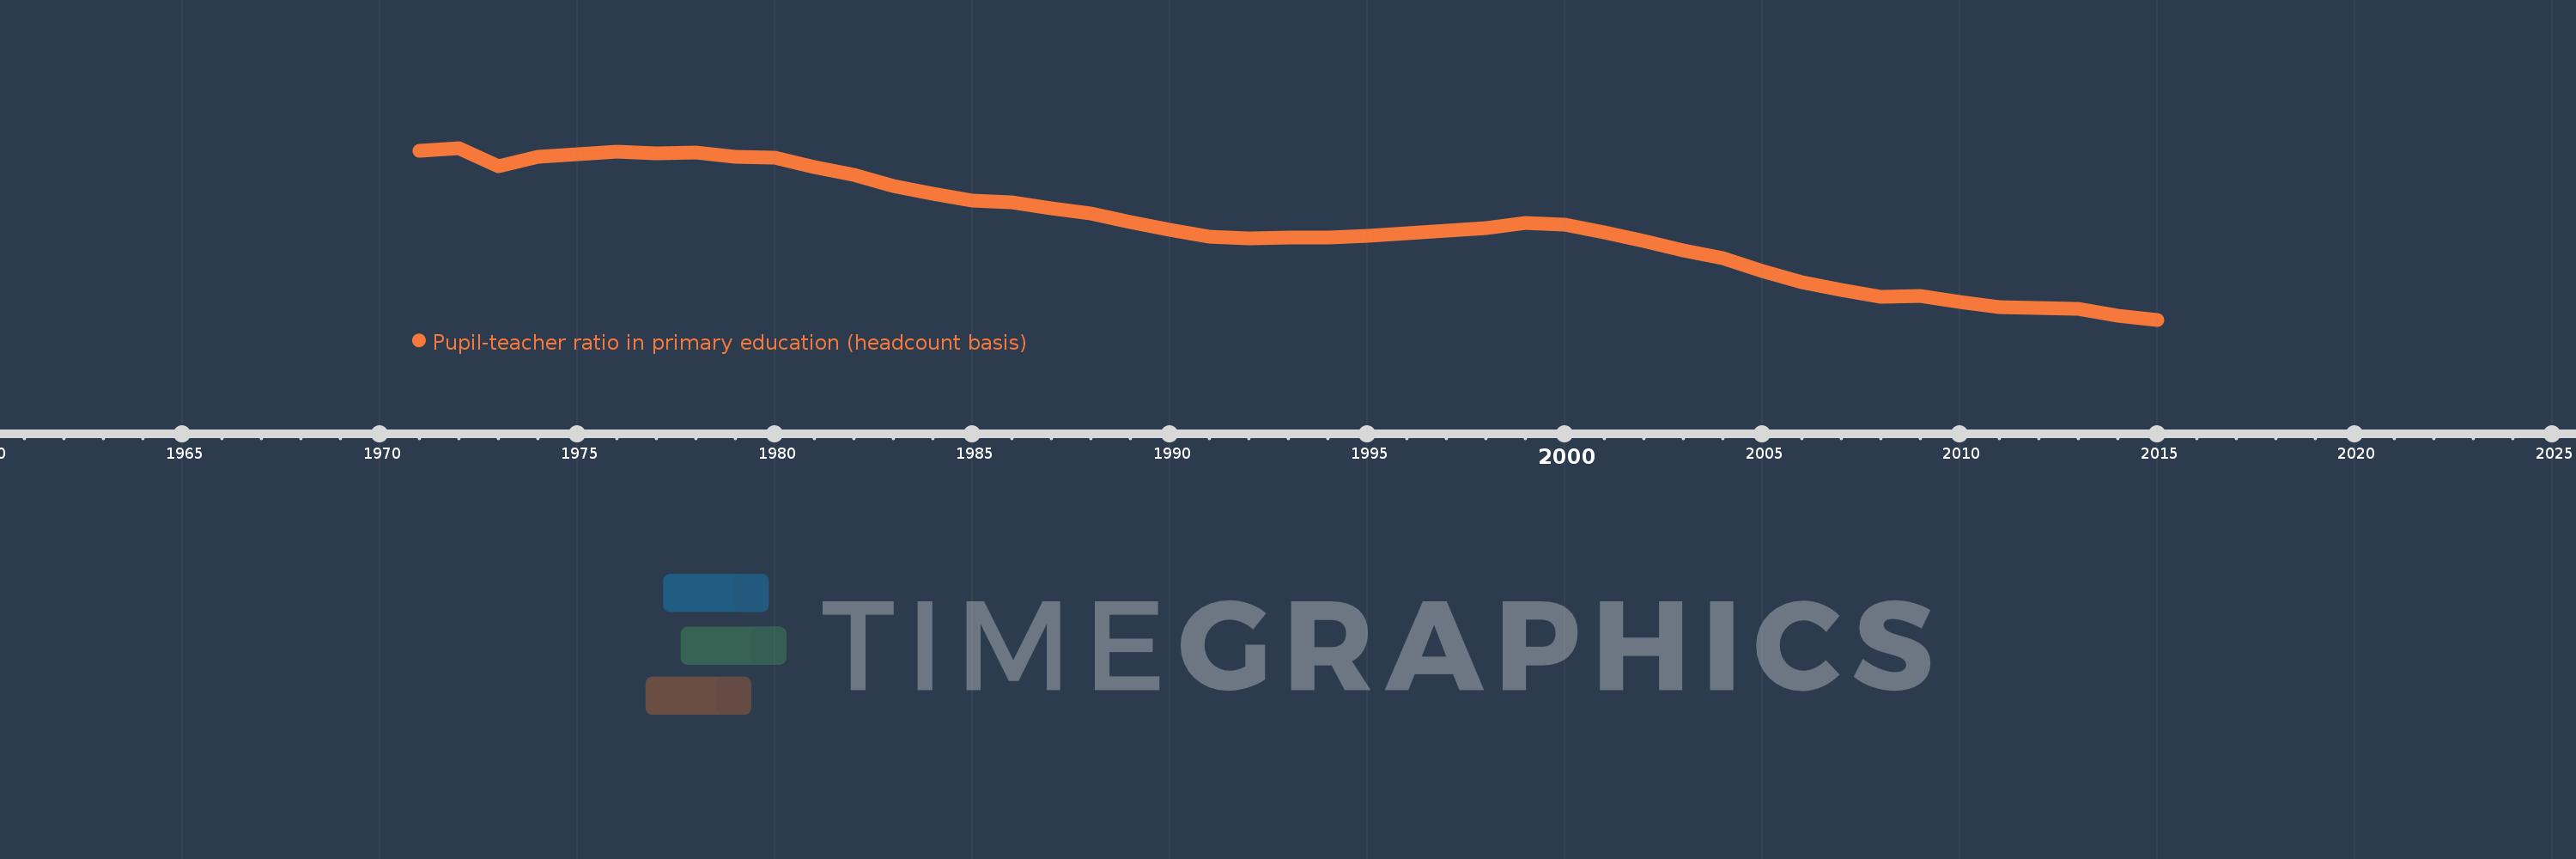
Pupil-teacher ratio in primary education (headcount basis)
2015,2014,2013,2012,2011,2010,2009,2008,2007,2006,2005,2004,2003,2002,2001,2000,1999,1998,1997,1996,1995,1994,1993,1992,1991,1990,1989,1988,1987,1986,1985,1984,1983,1982,1981,1980,1979,1978,1977,1976,1975,1974,1973,1972,1971
This statistics in other country:
AfghanistanAlbaniaAlgeriaAndorraAngolaAntigua and BarbudaArab WorldArgentinaArmeniaArubaAustraliaAustriaAzerbaijanBahamas, TheBahrainBangladeshBarbadosBelarusBelgiumBelizeBeninBermudaBhutanBoliviaBosnia and HerzegovinaBotswanaBrazilBritish Virgin IslandsBrunei DarussalamBulgariaBurkina FasoBurundiCabo VerdeCambodiaCameroonCanadaCaribbean small statesCayman IslandsCentral African RepublicCentral Europe and the BalticsChadChileChinaColombiaComorosCongo, Dem. Rep.Congo, Rep.Costa RicaCote d'IvoireCroatiaCubaCyprusCzech RepublicDenmarkDjiboutiDominicaDominican RepublicEarly-demographic dividendEast Asia & PacificEast Asia & Pacific (excluding high income)East Asia & Pacific (IDA & IBRD countries)EcuadorEgypt, Arab Rep.El SalvadorEquatorial GuineaEritreaEstoniaEthiopiaEuro areaEurope & Central AsiaEurope & Central Asia (excluding high income)Europe & Central Asia (IDA & IBRD countries)European UnionFijiFinlandFragile and conflict affected situationsFranceGabonGambia, TheGeorgiaGermanyGhanaGibraltarGreeceGrenadaGuatemalaGuineaGuinea-BissauGuyanaHaitiHeavily indebted poor countries (HIPC)High incomeHondurasHong Kong SAR, ChinaHungaryIBRD onlyIcelandIDA & IBRD totalIDA blendIDA onlyIDA totalIndiaIndonesiaIran, Islamic Rep.IraqIrelandIsraelItalyJamaicaJapanJordanKazakhstanKenyaKiribatiKorea, Dem. People’s Rep.Korea, Rep.KuwaitKyrgyz RepublicLao PDRLate-demographic dividendLatin America & Caribbean Latin America & Caribbean (excluding high income)Latin America & the Caribbean (IDA & IBRD countries)LatviaLeast developed countries: UN classificationLebanonLesothoLiberiaLibyaLiechtensteinLithuaniaLow & middle incomeLow incomeLower middle incomeLuxembourgMacao SAR, ChinaMacedonia, FYRMadagascarMalawiMalaysiaMaldivesMaliMaltaMarshall IslandsMauritaniaMauritiusMexicoMicronesia, Fed. Sts.Middle East & North AfricaMiddle East & North Africa (excluding high income)Middle East & North Africa (IDA & IBRD countries)Middle incomeMoldovaMonacoMongoliaMoroccoMozambiqueMyanmarNamibiaNauruNepalNetherlandsNew ZealandNicaraguaNigerNigeriaNorth AmericaNorwayOECD membersOmanOther small statesPacific island small statesPakistanPalauPanamaPapua New GuineaParaguayPeruPhilippinesPolandPortugalPost-demographic dividendPre-demographic dividendPuerto RicoQatarRomaniaRussian FederationRwandaSamoaSan MarinoSao Tome and PrincipeSaudi ArabiaSenegalSerbiaSeychellesSierra LeoneSingaporeSint Maarten (Dutch part)Slovak RepublicSloveniaSmall statesSolomon IslandsSomaliaSouth AfricaSouth AsiaSouth Asia (IDA & IBRD)South SudanSpainSri LankaSt. Kitts and NevisSt. LuciaSt. Vincent and the GrenadinesSub-Saharan Africa Sub-Saharan Africa (excluding high income)Sub-Saharan Africa (IDA & IBRD countries)SudanSurinameSwazilandSwedenSwitzerlandSyrian Arab RepublicTajikistanTanzaniaThailandTimor-LesteTogoTongaTrinidad and TobagoTunisiaTurkeyTurks and Caicos IslandsTuvaluUgandaUkraineUnited Arab EmiratesUnited KingdomUnited StatesUpper middle incomeUruguayUzbekistanVanuatuVenezuela, RBVietnamWest Bank and GazaWorldYemen, Rep.ZambiaZimbabwe Timeline:
This timeline shows a graph from 1971 to 2015 of East Asia & Pacific. No data until 1970. Number of actual observations by date: 45.
Source name:
World Development Indicators
Source organization:
UNESCO Institute for Statistics
Categories, topics:
Education
Last updated:
apr 23, 2017
Indicators value changes by year
Minimum:
17.498
jan 1, 2015
Maximum:
29.889
jan 1, 1972
At the date of observation
Value
Absolute change
Change from previous value
jan 1, 1971
29.712
+29.712
0.0%
jan 1, 1972
29.889
+0.177
0.6%
jan 1, 1973
28.559
-1.331
-4.45%
jan 1, 1974
29.28
+0.721
2.52%
jan 1, 1975
29.438
+0.159
0.54%
jan 1, 1976
29.632
+0.194
0.66%
jan 1, 1977
29.474
-0.158
-0.53%
jan 1, 1978
29.539
+0.064
0.22%
jan 1, 1979
29.273
-0.266
-0.9%
jan 1, 1980
29.188
-0.084
-0.29%
jan 1, 1981
28.511
-0.678
-2.32%
jan 1, 1982
27.94
-0.571
-2.0%
jan 1, 1983
27.163
-0.777
-2.78%
jan 1, 1984
26.584
-0.579
-2.13%
jan 1, 1985
26.073
-0.511
-1.92%
jan 1, 1986
25.988
-0.085
-0.33%
jan 1, 1987
25.562
-0.425
-1.64%
jan 1, 1988
25.153
-0.41
-1.6%
jan 1, 1989
24.572
-0.581
-2.31%
jan 1, 1990
24.002
-0.569
-2.32%
jan 1, 1991
23.518
-0.485
-2.02%
jan 1, 1992
23.378
-0.14
-0.59%
jan 1, 1993
23.411
+0.033
0.14%
jan 1, 1994
23.457
+0.046
0.2%
jan 1, 1995
23.564
+0.107
0.46%
jan 1, 1996
23.708
+0.144
0.61%
jan 1, 1997
23.931
+0.223
0.94%
jan 1, 1998
24.117
+0.186
0.78%
jan 1, 1999
24.461
+0.343
1.42%
jan 1, 2000
24.338
-0.123
-0.5%
jan 1, 2001
23.821
-0.516
-2.12%
jan 1, 2002
23.164
-0.658
-2.76%
jan 1, 2003
22.515
-0.648
-2.8%
jan 1, 2004
21.941
-0.574
-2.55%
jan 1, 2005
20.987
-0.954
-4.35%
jan 1, 2006
20.221
-0.766
-3.65%
jan 1, 2007
19.654
-0.567
-2.8%
jan 1, 2008
19.159
-0.495
-2.52%
jan 1, 2009
19.232
+0.073
0.38%
jan 1, 2010
18.769
-0.463
-2.41%
jan 1, 2011
18.416
-0.353
-1.88%
jan 1, 2012
18.317
-0.099
-0.54%
jan 1, 2013
18.282
-0.035
-0.19%
jan 1, 2014
17.79
-0.492
-2.69%
jan 1, 2015
17.498
-0.292
-1.64%
Ranking of countries by current statistics by years


Comments: