29
/
en
AIzaSyAYiBZKx7MnpbEhh9jyipgxe19OcubqV5w
April 1, 2024
38539
IDA blend
IDB
false
2
1
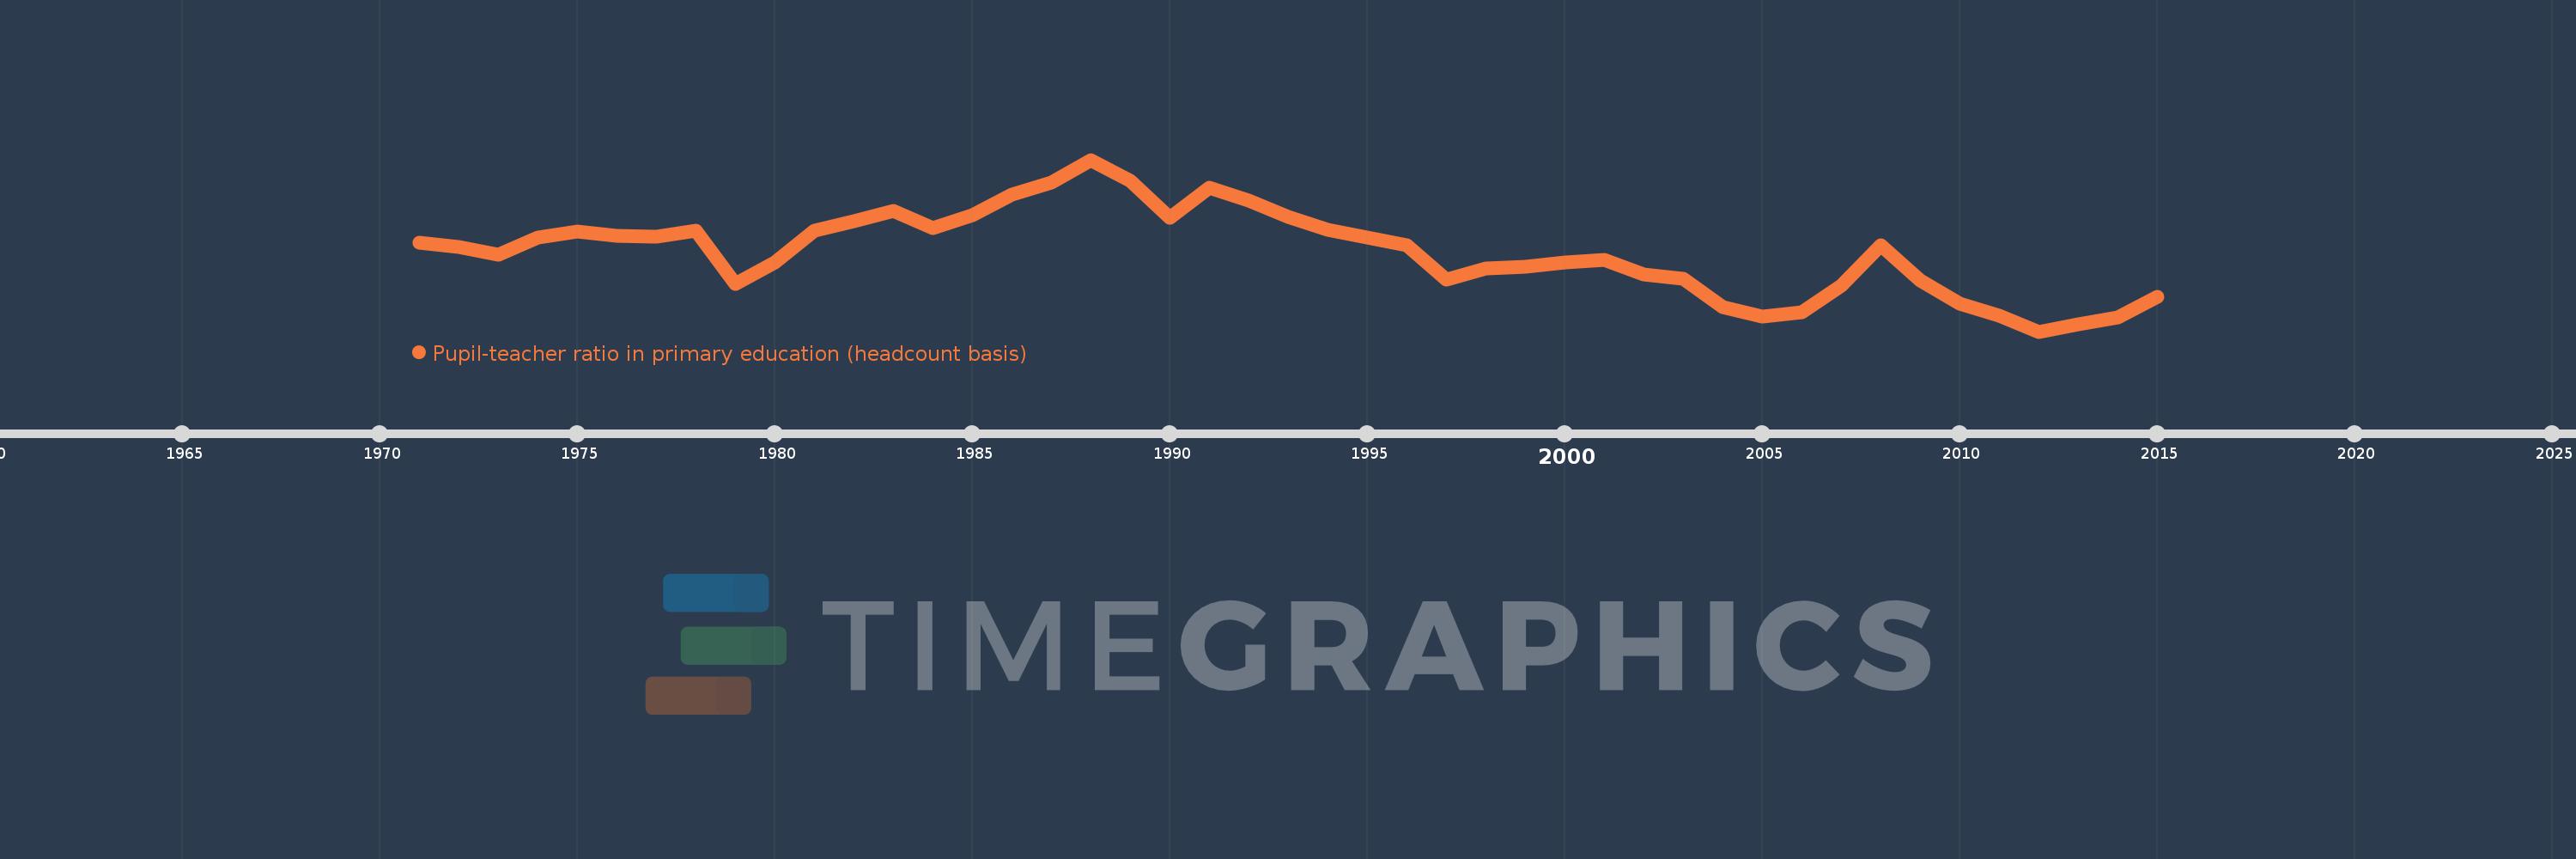
Pupil-teacher ratio in primary education (headcount basis)
2015,2014,2013,2012,2011,2010,2009,2008,2007,2006,2005,2004,2003,2002,2001,2000,1999,1998,1997,1996,1995,1994,1993,1992,1991,1990,1989,1988,1987,1986,1985,1984,1983,1982,1981,1980,1979,1978,1977,1976,1975,1974,1973,1972,1971
This statistics in other country:
AfghanistanAlbaniaAlgeriaAndorraAngolaAntigua and BarbudaArab WorldArgentinaArmeniaArubaAustraliaAustriaAzerbaijanBahamas, TheBahrainBangladeshBarbadosBelarusBelgiumBelizeBeninBermudaBhutanBoliviaBosnia and HerzegovinaBotswanaBrazilBritish Virgin IslandsBrunei DarussalamBulgariaBurkina FasoBurundiCabo VerdeCambodiaCameroonCanadaCaribbean small statesCayman IslandsCentral African RepublicCentral Europe and the BalticsChadChileChinaColombiaComorosCongo, Dem. Rep.Congo, Rep.Costa RicaCote d'IvoireCroatiaCubaCyprusCzech RepublicDenmarkDjiboutiDominicaDominican RepublicEarly-demographic dividendEast Asia & PacificEast Asia & Pacific (excluding high income)East Asia & Pacific (IDA & IBRD countries)EcuadorEgypt, Arab Rep.El SalvadorEquatorial GuineaEritreaEstoniaEthiopiaEuro areaEurope & Central AsiaEurope & Central Asia (excluding high income)Europe & Central Asia (IDA & IBRD countries)European UnionFijiFinlandFragile and conflict affected situationsFranceGabonGambia, TheGeorgiaGermanyGhanaGibraltarGreeceGrenadaGuatemalaGuineaGuinea-BissauGuyanaHaitiHeavily indebted poor countries (HIPC)High incomeHondurasHong Kong SAR, ChinaHungaryIBRD onlyIcelandIDA & IBRD totalIDA blendIDA onlyIDA totalIndiaIndonesiaIran, Islamic Rep.IraqIrelandIsraelItalyJamaicaJapanJordanKazakhstanKenyaKiribatiKorea, Dem. People’s Rep.Korea, Rep.KuwaitKyrgyz RepublicLao PDRLate-demographic dividendLatin America & Caribbean Latin America & Caribbean (excluding high income)Latin America & the Caribbean (IDA & IBRD countries)LatviaLeast developed countries: UN classificationLebanonLesothoLiberiaLibyaLiechtensteinLithuaniaLow & middle incomeLow incomeLower middle incomeLuxembourgMacao SAR, ChinaMacedonia, FYRMadagascarMalawiMalaysiaMaldivesMaliMaltaMarshall IslandsMauritaniaMauritiusMexicoMicronesia, Fed. Sts.Middle East & North AfricaMiddle East & North Africa (excluding high income)Middle East & North Africa (IDA & IBRD countries)Middle incomeMoldovaMonacoMongoliaMoroccoMozambiqueMyanmarNamibiaNauruNepalNetherlandsNew ZealandNicaraguaNigerNigeriaNorth AmericaNorwayOECD membersOmanOther small statesPacific island small statesPakistanPalauPanamaPapua New GuineaParaguayPeruPhilippinesPolandPortugalPost-demographic dividendPre-demographic dividendPuerto RicoQatarRomaniaRussian FederationRwandaSamoaSan MarinoSao Tome and PrincipeSaudi ArabiaSenegalSerbiaSeychellesSierra LeoneSingaporeSint Maarten (Dutch part)Slovak RepublicSloveniaSmall statesSolomon IslandsSomaliaSouth AfricaSouth AsiaSouth Asia (IDA & IBRD)South SudanSpainSri LankaSt. Kitts and NevisSt. LuciaSt. Vincent and the GrenadinesSub-Saharan Africa Sub-Saharan Africa (excluding high income)Sub-Saharan Africa (IDA & IBRD countries)SudanSurinameSwazilandSwedenSwitzerlandSyrian Arab RepublicTajikistanTanzaniaThailandTimor-LesteTogoTongaTrinidad and TobagoTunisiaTurkeyTurks and Caicos IslandsTuvaluUgandaUkraineUnited Arab EmiratesUnited KingdomUnited StatesUpper middle incomeUruguayUzbekistanVanuatuVenezuela, RBVietnamWest Bank and GazaWorldYemen, Rep.ZambiaZimbabwe Timeline:
This timeline shows a graph from 1971 to 2015 of IDA blend. No data until 1970. Number of actual observations by date: 45.
Source name:
World Development Indicators
Source organization:
UNESCO Institute for Statistics
Categories, topics:
Education
Last updated:
apr 23, 2017
Indicators value changes by year
Minimum:
31.849
jan 1, 2012
Maximum:
37.909
jan 1, 1988
At the date of observation
Value
Absolute change
Change from previous value
jan 1, 1971
34.999
+34.999
0.0%
jan 1, 1972
34.833
-0.166
-0.47%
jan 1, 1973
34.574
-0.259
-0.74%
jan 1, 1974
35.161
+0.586
1.7%
jan 1, 1975
35.378
+0.218
0.62%
jan 1, 1976
35.236
-0.142
-0.4%
jan 1, 1977
35.196
-0.04
-0.11%
jan 1, 1978
35.416
+0.22
0.63%
jan 1, 1979
33.523
-1.893
-5.35%
jan 1, 1980
34.287
+0.764
2.28%
jan 1, 1981
35.417
+1.13
3.3%
jan 1, 1982
35.734
+0.317
0.89%
jan 1, 1983
36.103
+0.369
1.03%
jan 1, 1984
35.512
-0.591
-1.64%
jan 1, 1985
35.952
+0.44
1.24%
jan 1, 1986
36.668
+0.717
1.99%
jan 1, 1987
37.098
+0.43
1.17%
jan 1, 1988
37.909
+0.811
2.19%
jan 1, 1989
37.162
-0.747
-1.97%
jan 1, 1990
35.867
-1.295
-3.49%
jan 1, 1991
36.924
+1.057
2.95%
jan 1, 1992
36.466
-0.458
-1.24%
jan 1, 1993
35.883
-0.583
-1.6%
jan 1, 1994
35.431
-0.452
-1.26%
jan 1, 1995
35.172
-0.259
-0.73%
jan 1, 1996
34.908
-0.263
-0.75%
jan 1, 1997
33.684
-1.224
-3.51%
jan 1, 1998
34.087
+0.403
1.2%
jan 1, 1999
34.129
+0.042
0.12%
jan 1, 2000
34.288
+0.159
0.47%
jan 1, 2001
34.393
+0.105
0.31%
jan 1, 2002
33.879
-0.514
-1.49%
jan 1, 2003
33.715
-0.164
-0.48%
jan 1, 2004
32.712
-1.003
-2.97%
jan 1, 2005
32.39
-0.322
-0.99%
jan 1, 2006
32.542
+0.152
0.47%
jan 1, 2007
33.473
+0.931
2.86%
jan 1, 2008
34.9
+1.428
4.27%
jan 1, 2009
33.655
-1.245
-3.57%
jan 1, 2010
32.834
-0.821
-2.44%
jan 1, 2011
32.423
-0.411
-1.25%
jan 1, 2012
31.849
-0.574
-1.77%
jan 1, 2013
32.113
+0.264
0.83%
jan 1, 2014
32.358
+0.245
0.76%
jan 1, 2015
33.089
+0.731
2.26%
Ranking of countries by current statistics by years


Comments: