29
/
en
AIzaSyAYiBZKx7MnpbEhh9jyipgxe19OcubqV5w
April 1, 2024
211030
Nicaragua
NIC
true
2
1
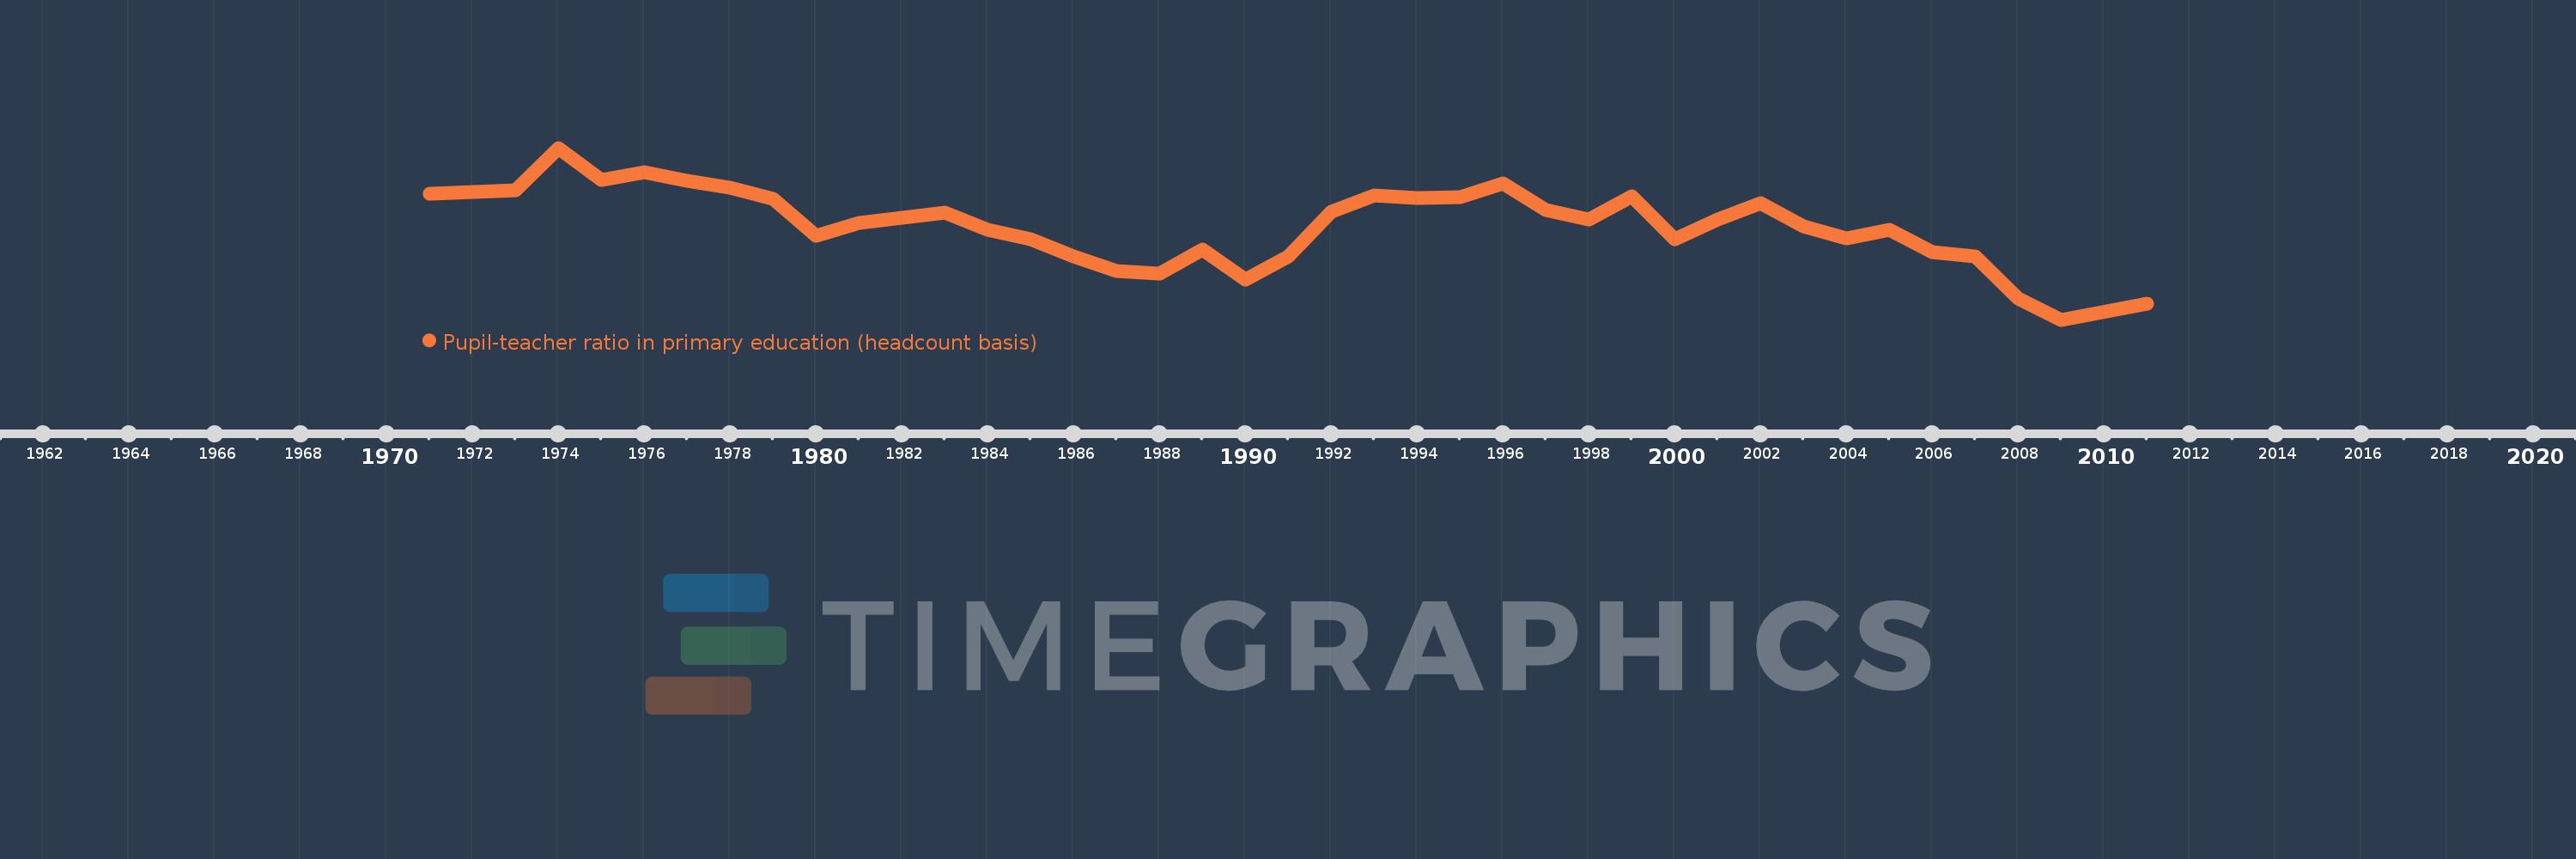
Pupil-teacher ratio in primary education (headcount basis)
2011,2009,2008,2007,2006,2005,2004,2003,2002,2001,2000,1999,1998,1997,1996,1995,1994,1993,1992,1991,1990,1989,1988,1987,1986,1985,1984,1983,1981,1980,1979,1978,1977,1976,1975,1974,1973,1972,1971
This statistics in other country:
AfghanistanAlbaniaAlgeriaAndorraAngolaAntigua and BarbudaArab WorldArgentinaArmeniaArubaAustraliaAustriaAzerbaijanBahamas, TheBahrainBangladeshBarbadosBelarusBelgiumBelizeBeninBermudaBhutanBoliviaBosnia and HerzegovinaBotswanaBrazilBritish Virgin IslandsBrunei DarussalamBulgariaBurkina FasoBurundiCabo VerdeCambodiaCameroonCanadaCaribbean small statesCayman IslandsCentral African RepublicCentral Europe and the BalticsChadChileChinaColombiaComorosCongo, Dem. Rep.Congo, Rep.Costa RicaCote d'IvoireCroatiaCubaCyprusCzech RepublicDenmarkDjiboutiDominicaDominican RepublicEarly-demographic dividendEast Asia & PacificEast Asia & Pacific (excluding high income)East Asia & Pacific (IDA & IBRD countries)EcuadorEgypt, Arab Rep.El SalvadorEquatorial GuineaEritreaEstoniaEthiopiaEuro areaEurope & Central AsiaEurope & Central Asia (excluding high income)Europe & Central Asia (IDA & IBRD countries)European UnionFijiFinlandFragile and conflict affected situationsFranceGabonGambia, TheGeorgiaGermanyGhanaGibraltarGreeceGrenadaGuatemalaGuineaGuinea-BissauGuyanaHaitiHeavily indebted poor countries (HIPC)High incomeHondurasHong Kong SAR, ChinaHungaryIBRD onlyIcelandIDA & IBRD totalIDA blendIDA onlyIDA totalIndiaIndonesiaIran, Islamic Rep.IraqIrelandIsraelItalyJamaicaJapanJordanKazakhstanKenyaKiribatiKorea, Dem. People’s Rep.Korea, Rep.KuwaitKyrgyz RepublicLao PDRLate-demographic dividendLatin America & Caribbean Latin America & Caribbean (excluding high income)Latin America & the Caribbean (IDA & IBRD countries)LatviaLeast developed countries: UN classificationLebanonLesothoLiberiaLibyaLiechtensteinLithuaniaLow & middle incomeLow incomeLower middle incomeLuxembourgMacao SAR, ChinaMacedonia, FYRMadagascarMalawiMalaysiaMaldivesMaliMaltaMarshall IslandsMauritaniaMauritiusMexicoMicronesia, Fed. Sts.Middle East & North AfricaMiddle East & North Africa (excluding high income)Middle East & North Africa (IDA & IBRD countries)Middle incomeMoldovaMonacoMongoliaMoroccoMozambiqueMyanmarNamibiaNauruNepalNetherlandsNew ZealandNicaraguaNigerNigeriaNorth AmericaNorwayOECD membersOmanOther small statesPacific island small statesPakistanPalauPanamaPapua New GuineaParaguayPeruPhilippinesPolandPortugalPost-demographic dividendPre-demographic dividendPuerto RicoQatarRomaniaRussian FederationRwandaSamoaSan MarinoSao Tome and PrincipeSaudi ArabiaSenegalSerbiaSeychellesSierra LeoneSingaporeSint Maarten (Dutch part)Slovak RepublicSloveniaSmall statesSolomon IslandsSomaliaSouth AfricaSouth AsiaSouth Asia (IDA & IBRD)South SudanSpainSri LankaSt. Kitts and NevisSt. LuciaSt. Vincent and the GrenadinesSub-Saharan Africa Sub-Saharan Africa (excluding high income)Sub-Saharan Africa (IDA & IBRD countries)SudanSurinameSwazilandSwedenSwitzerlandSyrian Arab RepublicTajikistanTanzaniaThailandTimor-LesteTogoTongaTrinidad and TobagoTunisiaTurkeyTurks and Caicos IslandsTuvaluUgandaUkraineUnited Arab EmiratesUnited KingdomUnited StatesUpper middle incomeUruguayUzbekistanVanuatuVenezuela, RBVietnamWest Bank and GazaWorldYemen, Rep.ZambiaZimbabwe Timeline:
This timeline shows a graph from 1971 to 2011 of Nicaragua. No data until 1970. Number of actual observations by date: 39.
Source name:
World Development Indicators
Source organization:
UNESCO Institute for Statistics
Categories, topics:
Education
Last updated:
apr 23, 2017
Indicators value changes by year
Minimum:
29.192
jan 1, 2009
Maximum:
40.294
jan 1, 1974
At the date of observation
Value
Absolute change
Change from previous value
jan 1, 1971
37.317
+37.317
0.0%
jan 1, 1972
37.449
+0.133
0.36%
jan 1, 1973
37.559
+0.109
0.29%
jan 1, 1974
40.294
+2.735
7.28%
jan 1, 1975
38.213
-2.081
-5.17%
jan 1, 1976
38.736
+0.523
1.37%
jan 1, 1977
38.172
-0.563
-1.45%
jan 1, 1978
37.738
-0.434
-1.14%
jan 1, 1979
37.016
-0.722
-1.91%
jan 1, 1980
34.599
-2.417
-6.53%
jan 1, 1981
35.453
+0.855
2.47%
jan 1, 1983
36.104
+0.65
1.83%
jan 1, 1984
35.009
-1.094
-3.03%
jan 1, 1985
34.397
-0.613
-1.75%
jan 1, 1986
33.283
-1.114
-3.24%
jan 1, 1987
32.367
-0.916
-2.75%
jan 1, 1988
32.184
-0.183
-0.57%
jan 1, 1989
33.738
+1.553
4.83%
jan 1, 1990
31.773
-1.965
-5.82%
jan 1, 1991
33.271
+1.498
4.72%
jan 1, 1992
36.15
+2.879
8.65%
jan 1, 1993
37.239
+1.089
3.01%
jan 1, 1994
37.035
-0.204
-0.55%
jan 1, 1995
37.136
+0.101
0.27%
jan 1, 1996
38.009
+0.873
2.35%
jan 1, 1997
36.285
-1.724
-4.54%
jan 1, 1998
35.673
-0.612
-1.69%
jan 1, 1999
37.182
+1.509
4.23%
jan 1, 2000
34.386
-2.796
-7.52%
jan 1, 2001
35.663
+1.277
3.71%
jan 1, 2002
36.716
+1.053
2.95%
jan 1, 2003
35.209
-1.507
-4.1%
jan 1, 2004
34.47
-0.739
-2.1%
jan 1, 2005
35.018
+0.548
1.59%
jan 1, 2006
33.558
-1.46
-4.17%
jan 1, 2007
33.273
-0.285
-0.85%
jan 1, 2008
30.555
-2.717
-8.17%
jan 1, 2009
29.192
-1.363
-4.46%
jan 1, 2011
30.216
+1.024
3.51%
Ranking of countries by current statistics by years


Comments: