29
/
en
AIzaSyAYiBZKx7MnpbEhh9jyipgxe19OcubqV5w
April 1, 2024
111565
Congo, Rep.
COG
true
2
1
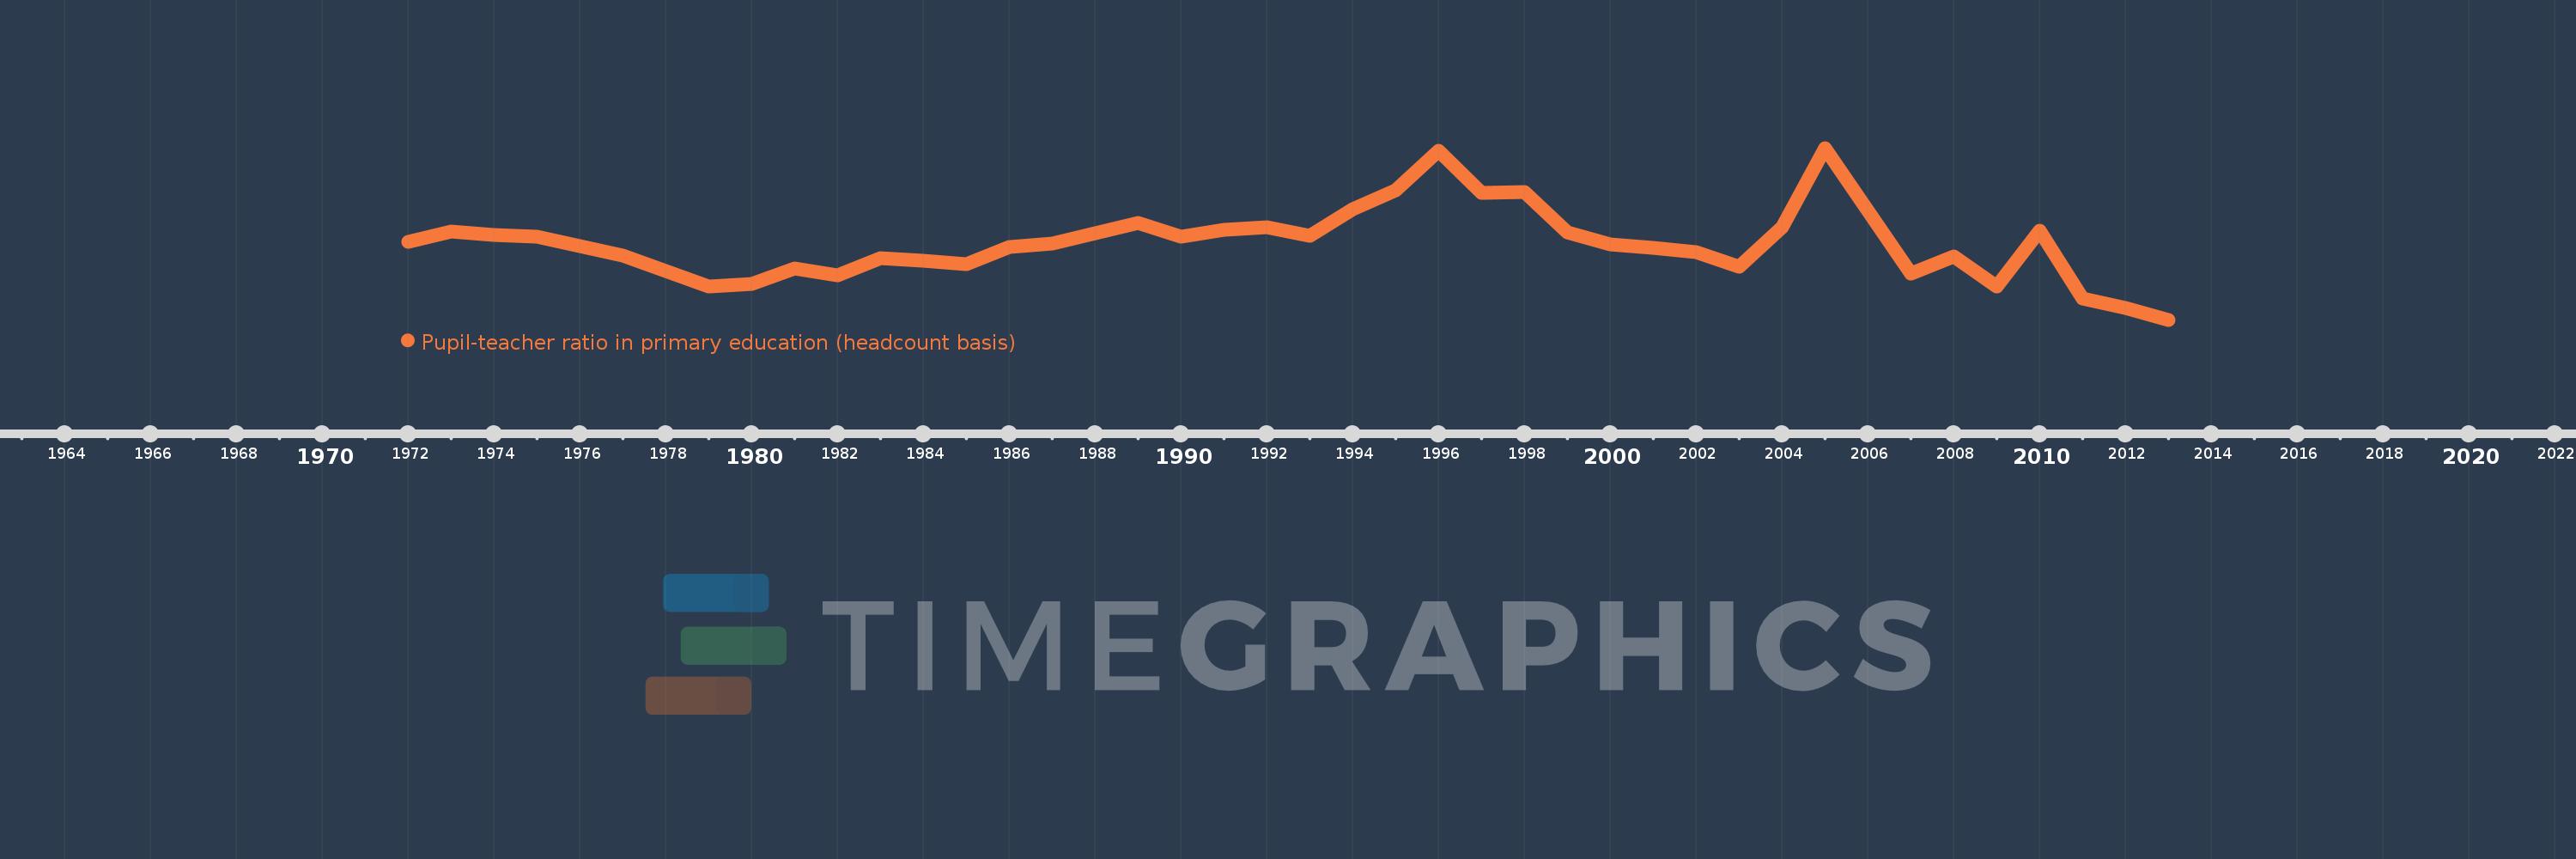
Pupil-teacher ratio in primary education (headcount basis)
2013,2012,2011,2010,2009,2008,2007,2005,2004,2003,2002,2001,2000,1999,1998,1997,1996,1995,1994,1993,1992,1991,1990,1989,1988,1987,1986,1985,1984,1983,1982,1981,1980,1979,1977,1976,1975,1974,1973,1972
This statistics in other country:
AfghanistanAlbaniaAlgeriaAndorraAngolaAntigua and BarbudaArab WorldArgentinaArmeniaArubaAustraliaAustriaAzerbaijanBahamas, TheBahrainBangladeshBarbadosBelarusBelgiumBelizeBeninBermudaBhutanBoliviaBosnia and HerzegovinaBotswanaBrazilBritish Virgin IslandsBrunei DarussalamBulgariaBurkina FasoBurundiCabo VerdeCambodiaCameroonCanadaCaribbean small statesCayman IslandsCentral African RepublicCentral Europe and the BalticsChadChileChinaColombiaComorosCongo, Dem. Rep.Congo, Rep.Costa RicaCote d'IvoireCroatiaCubaCyprusCzech RepublicDenmarkDjiboutiDominicaDominican RepublicEarly-demographic dividendEast Asia & PacificEast Asia & Pacific (excluding high income)East Asia & Pacific (IDA & IBRD countries)EcuadorEgypt, Arab Rep.El SalvadorEquatorial GuineaEritreaEstoniaEthiopiaEuro areaEurope & Central AsiaEurope & Central Asia (excluding high income)Europe & Central Asia (IDA & IBRD countries)European UnionFijiFinlandFragile and conflict affected situationsFranceGabonGambia, TheGeorgiaGermanyGhanaGibraltarGreeceGrenadaGuatemalaGuineaGuinea-BissauGuyanaHaitiHeavily indebted poor countries (HIPC)High incomeHondurasHong Kong SAR, ChinaHungaryIBRD onlyIcelandIDA & IBRD totalIDA blendIDA onlyIDA totalIndiaIndonesiaIran, Islamic Rep.IraqIrelandIsraelItalyJamaicaJapanJordanKazakhstanKenyaKiribatiKorea, Dem. People’s Rep.Korea, Rep.KuwaitKyrgyz RepublicLao PDRLate-demographic dividendLatin America & Caribbean Latin America & Caribbean (excluding high income)Latin America & the Caribbean (IDA & IBRD countries)LatviaLeast developed countries: UN classificationLebanonLesothoLiberiaLibyaLiechtensteinLithuaniaLow & middle incomeLow incomeLower middle incomeLuxembourgMacao SAR, ChinaMacedonia, FYRMadagascarMalawiMalaysiaMaldivesMaliMaltaMarshall IslandsMauritaniaMauritiusMexicoMicronesia, Fed. Sts.Middle East & North AfricaMiddle East & North Africa (excluding high income)Middle East & North Africa (IDA & IBRD countries)Middle incomeMoldovaMonacoMongoliaMoroccoMozambiqueMyanmarNamibiaNauruNepalNetherlandsNew ZealandNicaraguaNigerNigeriaNorth AmericaNorwayOECD membersOmanOther small statesPacific island small statesPakistanPalauPanamaPapua New GuineaParaguayPeruPhilippinesPolandPortugalPost-demographic dividendPre-demographic dividendPuerto RicoQatarRomaniaRussian FederationRwandaSamoaSan MarinoSao Tome and PrincipeSaudi ArabiaSenegalSerbiaSeychellesSierra LeoneSingaporeSint Maarten (Dutch part)Slovak RepublicSloveniaSmall statesSolomon IslandsSomaliaSouth AfricaSouth AsiaSouth Asia (IDA & IBRD)South SudanSpainSri LankaSt. Kitts and NevisSt. LuciaSt. Vincent and the GrenadinesSub-Saharan Africa Sub-Saharan Africa (excluding high income)Sub-Saharan Africa (IDA & IBRD countries)SudanSurinameSwazilandSwedenSwitzerlandSyrian Arab RepublicTajikistanTanzaniaThailandTimor-LesteTogoTongaTrinidad and TobagoTunisiaTurkeyTurks and Caicos IslandsTuvaluUgandaUkraineUnited Arab EmiratesUnited KingdomUnited StatesUpper middle incomeUruguayUzbekistanVanuatuVenezuela, RBVietnamWest Bank and GazaWorldYemen, Rep.ZambiaZimbabwe Timeline:
This timeline shows a graph from 1972 to 2013 of Congo, Rep.. No data until 1971. Number of actual observations by date: 40.
Source name:
World Development Indicators
Source organization:
UNESCO Institute for Statistics
Categories, topics:
Education
Last updated:
apr 23, 2017
Indicators value changes by year
Minimum:
44.442
jan 1, 2013
Maximum:
82.795
jan 1, 2005
At the date of observation
Value
Absolute change
Change from previous value
jan 1, 1972
61.852
+61.852
0.0%
jan 1, 1973
64.196
+2.343
3.79%
jan 1, 1974
63.431
-0.765
-1.19%
jan 1, 1975
63.04
-0.391
-0.62%
jan 1, 1976
60.794
-2.246
-3.56%
jan 1, 1977
58.723
-2.071
-3.41%
jan 1, 1979
51.796
-6.927
-11.8%
jan 1, 1980
52.512
+0.716
1.38%
jan 1, 1981
55.899
+3.387
6.45%
jan 1, 1982
54.366
-1.532
-2.74%
jan 1, 1983
58.144
+3.778
6.95%
jan 1, 1984
57.699
-0.445
-0.77%
jan 1, 1985
56.791
-0.907
-1.57%
jan 1, 1986
60.702
+3.91
6.89%
jan 1, 1987
61.434
+0.732
1.21%
jan 1, 1988
63.774
+2.341
3.81%
jan 1, 1989
66.097
+2.323
3.64%
jan 1, 1990
62.995
-3.102
-4.69%
jan 1, 1991
64.425
+1.43
2.27%
jan 1, 1992
65.178
+0.753
1.17%
jan 1, 1993
63.203
-1.975
-3.03%
jan 1, 1994
69.057
+5.855
9.26%
jan 1, 1995
73.418
+4.361
6.31%
jan 1, 1996
82.168
+8.75
11.92%
jan 1, 1997
72.748
-9.42
-11.46%
jan 1, 1998
72.918
+0.17
0.23%
jan 1, 1999
63.956
-8.962
-12.29%
jan 1, 2000
61.229
-2.726
-4.26%
jan 1, 2001
60.481
-0.749
-1.22%
jan 1, 2002
59.492
-0.989
-1.63%
jan 1, 2003
56.208
-3.284
-5.52%
jan 1, 2004
65.171
+8.963
15.95%
jan 1, 2005
82.795
+17.624
27.04%
jan 1, 2007
54.797
-27.999
-33.82%
jan 1, 2008
58.48
+3.683
6.72%
jan 1, 2009
51.805
-6.675
-11.41%
jan 1, 2010
64.381
+12.576
24.28%
jan 1, 2011
49.146
-15.235
-23.66%
jan 1, 2012
47.093
-2.053
-4.18%
jan 1, 2013
44.442
-2.651
-5.63%
Ranking of countries by current statistics by years


Comments: