29
/
en
AIzaSyAYiBZKx7MnpbEhh9jyipgxe19OcubqV5w
April 1, 2024
217095
Pakistan
PAK
true
2
1
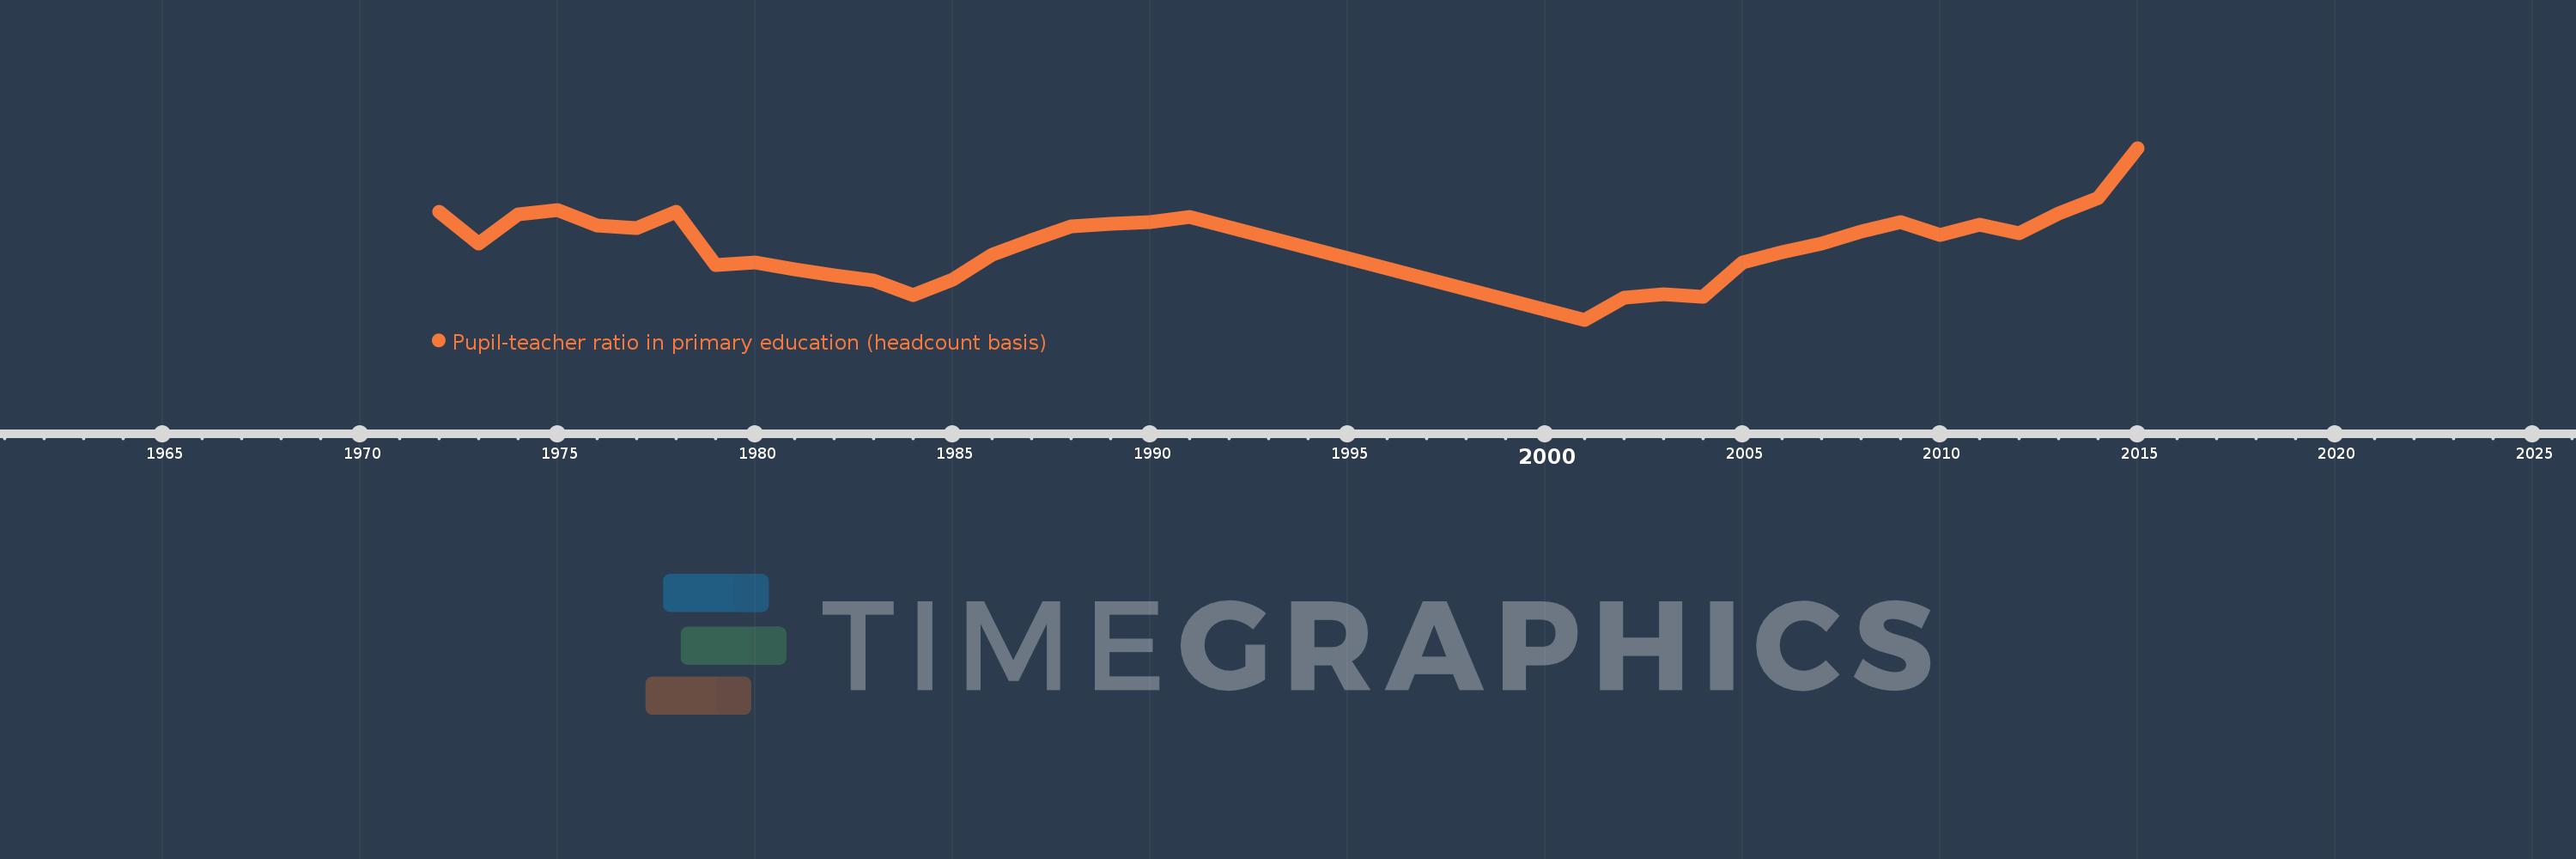
Pupil-teacher ratio in primary education (headcount basis)
2015,2014,2013,2012,2011,2010,2009,2008,2007,2006,2005,2004,2003,2002,2001,1991,1990,1989,1988,1987,1986,1985,1984,1983,1982,1981,1980,1979,1978,1977,1976,1975,1974,1973,1972
This statistics in other country:
AfghanistanAlbaniaAlgeriaAndorraAngolaAntigua and BarbudaArab WorldArgentinaArmeniaArubaAustraliaAustriaAzerbaijanBahamas, TheBahrainBangladeshBarbadosBelarusBelgiumBelizeBeninBermudaBhutanBoliviaBosnia and HerzegovinaBotswanaBrazilBritish Virgin IslandsBrunei DarussalamBulgariaBurkina FasoBurundiCabo VerdeCambodiaCameroonCanadaCaribbean small statesCayman IslandsCentral African RepublicCentral Europe and the BalticsChadChileChinaColombiaComorosCongo, Dem. Rep.Congo, Rep.Costa RicaCote d'IvoireCroatiaCubaCyprusCzech RepublicDenmarkDjiboutiDominicaDominican RepublicEarly-demographic dividendEast Asia & PacificEast Asia & Pacific (excluding high income)East Asia & Pacific (IDA & IBRD countries)EcuadorEgypt, Arab Rep.El SalvadorEquatorial GuineaEritreaEstoniaEthiopiaEuro areaEurope & Central AsiaEurope & Central Asia (excluding high income)Europe & Central Asia (IDA & IBRD countries)European UnionFijiFinlandFragile and conflict affected situationsFranceGabonGambia, TheGeorgiaGermanyGhanaGibraltarGreeceGrenadaGuatemalaGuineaGuinea-BissauGuyanaHaitiHeavily indebted poor countries (HIPC)High incomeHondurasHong Kong SAR, ChinaHungaryIBRD onlyIcelandIDA & IBRD totalIDA blendIDA onlyIDA totalIndiaIndonesiaIran, Islamic Rep.IraqIrelandIsraelItalyJamaicaJapanJordanKazakhstanKenyaKiribatiKorea, Dem. People’s Rep.Korea, Rep.KuwaitKyrgyz RepublicLao PDRLate-demographic dividendLatin America & Caribbean Latin America & Caribbean (excluding high income)Latin America & the Caribbean (IDA & IBRD countries)LatviaLeast developed countries: UN classificationLebanonLesothoLiberiaLibyaLiechtensteinLithuaniaLow & middle incomeLow incomeLower middle incomeLuxembourgMacao SAR, ChinaMacedonia, FYRMadagascarMalawiMalaysiaMaldivesMaliMaltaMarshall IslandsMauritaniaMauritiusMexicoMicronesia, Fed. Sts.Middle East & North AfricaMiddle East & North Africa (excluding high income)Middle East & North Africa (IDA & IBRD countries)Middle incomeMoldovaMonacoMongoliaMoroccoMozambiqueMyanmarNamibiaNauruNepalNetherlandsNew ZealandNicaraguaNigerNigeriaNorth AmericaNorwayOECD membersOmanOther small statesPacific island small statesPakistanPalauPanamaPapua New GuineaParaguayPeruPhilippinesPolandPortugalPost-demographic dividendPre-demographic dividendPuerto RicoQatarRomaniaRussian FederationRwandaSamoaSan MarinoSao Tome and PrincipeSaudi ArabiaSenegalSerbiaSeychellesSierra LeoneSingaporeSint Maarten (Dutch part)Slovak RepublicSloveniaSmall statesSolomon IslandsSomaliaSouth AfricaSouth AsiaSouth Asia (IDA & IBRD)South SudanSpainSri LankaSt. Kitts and NevisSt. LuciaSt. Vincent and the GrenadinesSub-Saharan Africa Sub-Saharan Africa (excluding high income)Sub-Saharan Africa (IDA & IBRD countries)SudanSurinameSwazilandSwedenSwitzerlandSyrian Arab RepublicTajikistanTanzaniaThailandTimor-LesteTogoTongaTrinidad and TobagoTunisiaTurkeyTurks and Caicos IslandsTuvaluUgandaUkraineUnited Arab EmiratesUnited KingdomUnited StatesUpper middle incomeUruguayUzbekistanVanuatuVenezuela, RBVietnamWest Bank and GazaWorldYemen, Rep.ZambiaZimbabwe Timeline:
This timeline shows a graph from 1972 to 2015 of Pakistan. No data until 1971. Number of actual observations by date: 35.
Source name:
World Development Indicators
Source organization:
UNESCO Institute for Statistics
Categories, topics:
Education
Last updated:
apr 23, 2017
Indicators value changes by year
Maximum:
46.523
jan 1, 2015
At the date of observation
Value
Absolute change
Change from previous value
jan 1, 1972
41.468
+41.468
0.0%
jan 1, 1973
38.982
-2.486
-5.99%
jan 1, 1974
41.288
+2.306
5.91%
jan 1, 1975
41.601
+0.313
0.76%
jan 1, 1976
40.441
-1.16
-2.79%
jan 1, 1977
40.187
-0.254
-0.63%
jan 1, 1978
41.471
+1.284
3.19%
jan 1, 1979
37.326
-4.145
-9.99%
jan 1, 1980
37.489
+0.163
0.44%
jan 1, 1981
36.986
-0.503
-1.34%
jan 1, 1982
36.49
-0.496
-1.34%
jan 1, 1983
36.096
-0.394
-1.08%
jan 1, 1984
34.971
-1.125
-3.12%
jan 1, 1985
36.165
+1.194
3.41%
jan 1, 1986
38.145
+1.98
5.48%
jan 1, 1987
39.276
+1.13
2.96%
jan 1, 1988
40.331
+1.056
2.69%
jan 1, 1989
40.563
+0.232
0.57%
jan 1, 1990
40.662
+0.098
0.24%
jan 1, 1991
41.071
+0.41
1.01%
jan 1, 2001
33.0
-8.071
-19.65%
jan 1, 2002
34.742
+1.742
5.28%
jan 1, 2003
35.005
+0.263
0.76%
jan 1, 2004
34.822
-0.183
-0.52%
jan 1, 2005
37.498
+2.676
7.68%
jan 1, 2006
38.339
+0.842
2.24%
jan 1, 2007
39.005
+0.666
1.74%
jan 1, 2008
39.951
+0.946
2.43%
jan 1, 2009
40.669
+0.717
1.8%
jan 1, 2010
39.688
-0.981
-2.41%
jan 1, 2011
40.452
+0.764
1.92%
jan 1, 2012
39.833
-0.619
-1.53%
jan 1, 2013
41.353
+1.52
3.82%
jan 1, 2014
42.549
+1.196
2.89%
jan 1, 2015
46.523
+3.974
9.34%
Ranking of countries by current statistics by years


Comments: