29
/
en
AIzaSyAYiBZKx7MnpbEhh9jyipgxe19OcubqV5w
April 1, 2024
54392
Pacific island small states
PSS
false
2
1
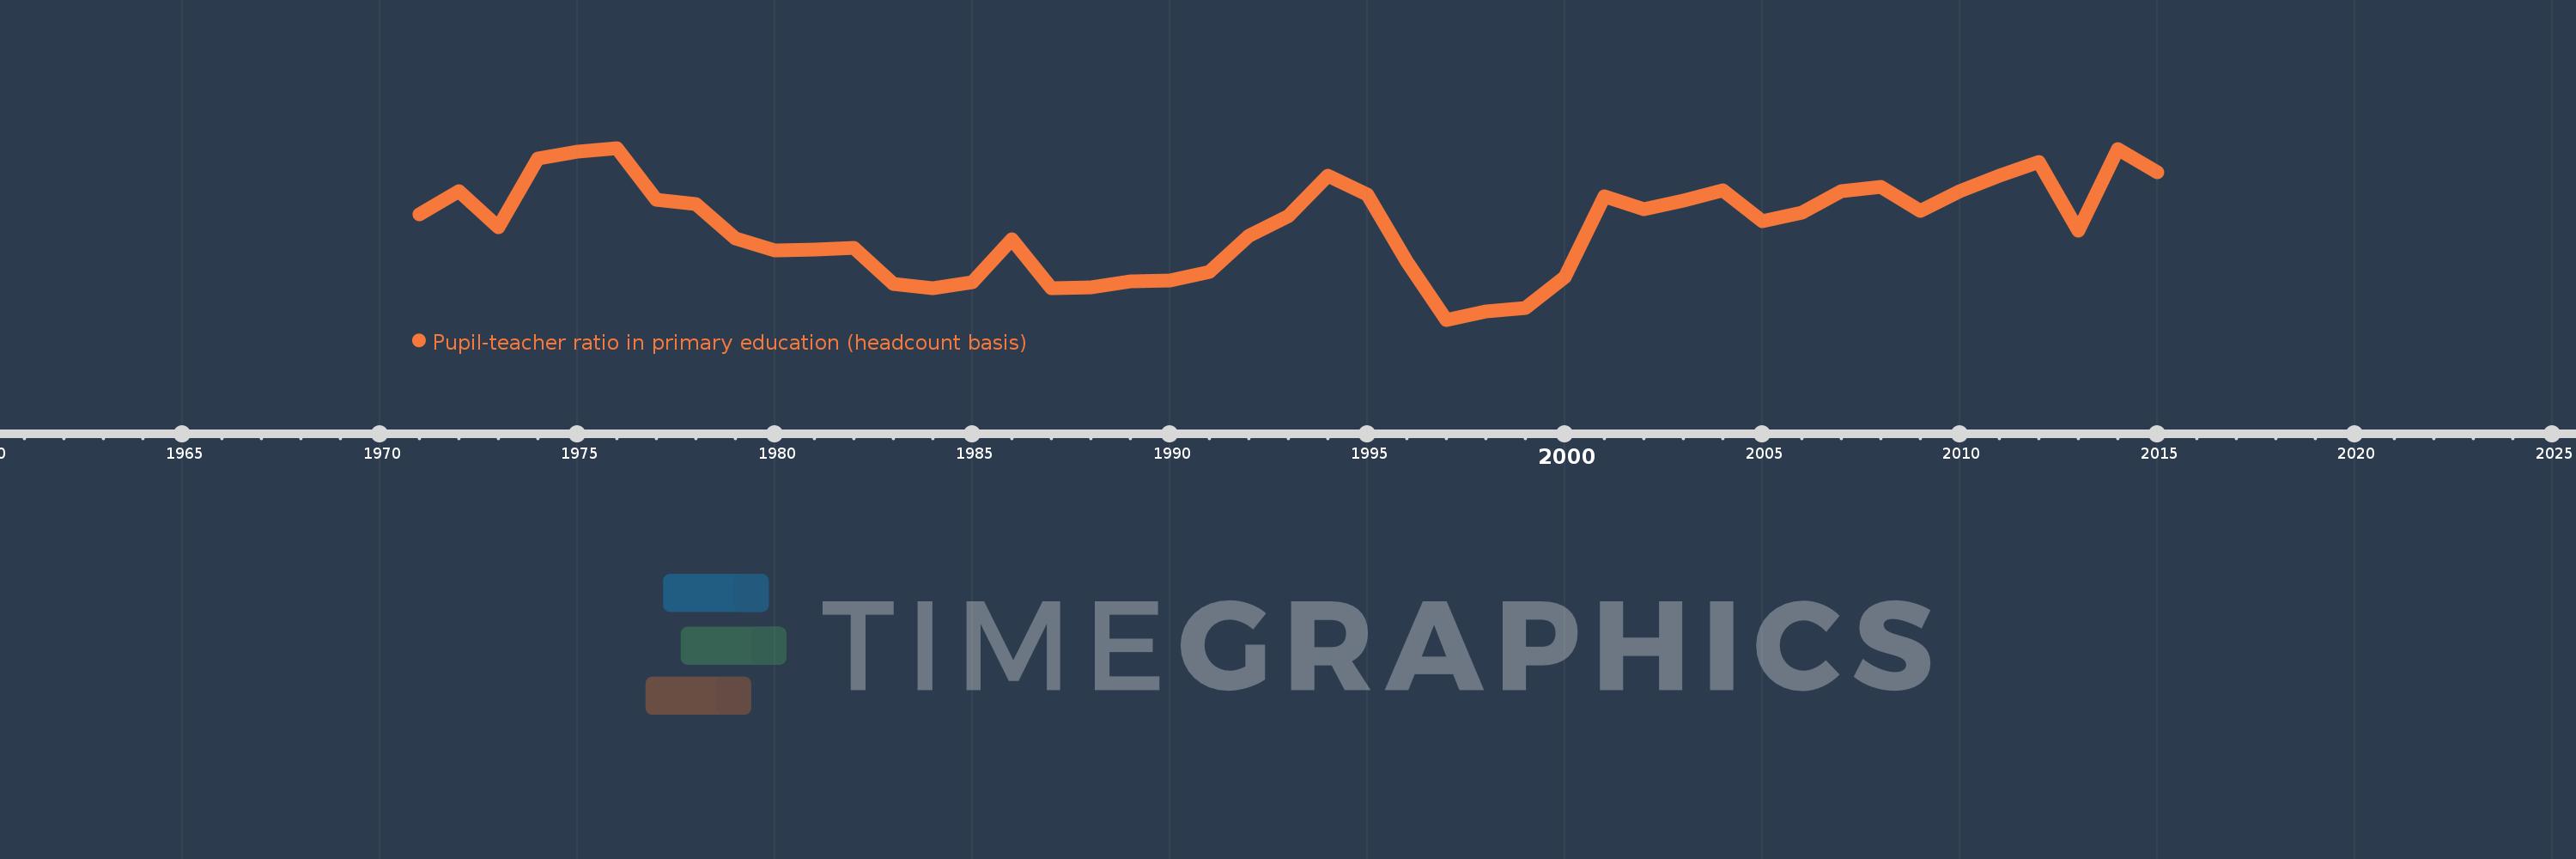
Pupil-teacher ratio in primary education (headcount basis)
2015,2014,2013,2012,2011,2010,2009,2008,2007,2006,2005,2004,2003,2002,2001,2000,1999,1998,1997,1996,1995,1994,1993,1992,1991,1990,1989,1988,1987,1986,1985,1984,1983,1982,1981,1980,1979,1978,1977,1976,1975,1974,1973,1972,1971
This statistics in other country:
AfghanistanAlbaniaAlgeriaAndorraAngolaAntigua and BarbudaArab WorldArgentinaArmeniaArubaAustraliaAustriaAzerbaijanBahamas, TheBahrainBangladeshBarbadosBelarusBelgiumBelizeBeninBermudaBhutanBoliviaBosnia and HerzegovinaBotswanaBrazilBritish Virgin IslandsBrunei DarussalamBulgariaBurkina FasoBurundiCabo VerdeCambodiaCameroonCanadaCaribbean small statesCayman IslandsCentral African RepublicCentral Europe and the BalticsChadChileChinaColombiaComorosCongo, Dem. Rep.Congo, Rep.Costa RicaCote d'IvoireCroatiaCubaCyprusCzech RepublicDenmarkDjiboutiDominicaDominican RepublicEarly-demographic dividendEast Asia & PacificEast Asia & Pacific (excluding high income)East Asia & Pacific (IDA & IBRD countries)EcuadorEgypt, Arab Rep.El SalvadorEquatorial GuineaEritreaEstoniaEthiopiaEuro areaEurope & Central AsiaEurope & Central Asia (excluding high income)Europe & Central Asia (IDA & IBRD countries)European UnionFijiFinlandFragile and conflict affected situationsFranceGabonGambia, TheGeorgiaGermanyGhanaGibraltarGreeceGrenadaGuatemalaGuineaGuinea-BissauGuyanaHaitiHeavily indebted poor countries (HIPC)High incomeHondurasHong Kong SAR, ChinaHungaryIBRD onlyIcelandIDA & IBRD totalIDA blendIDA onlyIDA totalIndiaIndonesiaIran, Islamic Rep.IraqIrelandIsraelItalyJamaicaJapanJordanKazakhstanKenyaKiribatiKorea, Dem. People’s Rep.Korea, Rep.KuwaitKyrgyz RepublicLao PDRLate-demographic dividendLatin America & Caribbean Latin America & Caribbean (excluding high income)Latin America & the Caribbean (IDA & IBRD countries)LatviaLeast developed countries: UN classificationLebanonLesothoLiberiaLibyaLiechtensteinLithuaniaLow & middle incomeLow incomeLower middle incomeLuxembourgMacao SAR, ChinaMacedonia, FYRMadagascarMalawiMalaysiaMaldivesMaliMaltaMarshall IslandsMauritaniaMauritiusMexicoMicronesia, Fed. Sts.Middle East & North AfricaMiddle East & North Africa (excluding high income)Middle East & North Africa (IDA & IBRD countries)Middle incomeMoldovaMonacoMongoliaMoroccoMozambiqueMyanmarNamibiaNauruNepalNetherlandsNew ZealandNicaraguaNigerNigeriaNorth AmericaNorwayOECD membersOmanOther small statesPacific island small statesPakistanPalauPanamaPapua New GuineaParaguayPeruPhilippinesPolandPortugalPost-demographic dividendPre-demographic dividendPuerto RicoQatarRomaniaRussian FederationRwandaSamoaSan MarinoSao Tome and PrincipeSaudi ArabiaSenegalSerbiaSeychellesSierra LeoneSingaporeSint Maarten (Dutch part)Slovak RepublicSloveniaSmall statesSolomon IslandsSomaliaSouth AfricaSouth AsiaSouth Asia (IDA & IBRD)South SudanSpainSri LankaSt. Kitts and NevisSt. LuciaSt. Vincent and the GrenadinesSub-Saharan Africa Sub-Saharan Africa (excluding high income)Sub-Saharan Africa (IDA & IBRD countries)SudanSurinameSwazilandSwedenSwitzerlandSyrian Arab RepublicTajikistanTanzaniaThailandTimor-LesteTogoTongaTrinidad and TobagoTunisiaTurkeyTurks and Caicos IslandsTuvaluUgandaUkraineUnited Arab EmiratesUnited KingdomUnited StatesUpper middle incomeUruguayUzbekistanVanuatuVenezuela, RBVietnamWest Bank and GazaWorldYemen, Rep.ZambiaZimbabwe Timeline:
This timeline shows a graph from 1971 to 2015 of Pacific island small states. No data until 1970. Number of actual observations by date: 45.
Source name:
World Development Indicators
Source organization:
UNESCO Institute for Statistics
Categories, topics:
Education
Last updated:
apr 23, 2017
Indicators value changes by year
Minimum:
21.806
jan 1, 1997
Maximum:
23.685
jan 1, 1976
At the date of observation
Value
Absolute change
Change from previous value
jan 1, 1971
22.959
+22.959
0.0%
jan 1, 1972
23.214
+0.255
1.11%
jan 1, 1973
22.822
-0.392
-1.69%
jan 1, 1974
23.573
+0.752
3.29%
jan 1, 1975
23.642
+0.068
0.29%
jan 1, 1976
23.685
+0.043
0.18%
jan 1, 1977
23.119
-0.566
-2.39%
jan 1, 1978
23.071
-0.048
-0.21%
jan 1, 1979
22.694
-0.377
-1.63%
jan 1, 1980
22.562
-0.132
-0.58%
jan 1, 1981
22.576
+0.014
0.06%
jan 1, 1982
22.593
+0.017
0.07%
jan 1, 1983
22.198
-0.395
-1.75%
jan 1, 1984
22.154
-0.044
-0.2%
jan 1, 1985
22.221
+0.067
0.3%
jan 1, 1986
22.688
+0.467
2.1%
jan 1, 1987
22.155
-0.533
-2.35%
jan 1, 1988
22.156
+0.002
0.01%
jan 1, 1989
22.229
+0.072
0.33%
jan 1, 1990
22.238
+0.009
0.04%
jan 1, 1991
22.331
+0.093
0.42%
jan 1, 1992
22.727
+0.396
1.77%
jan 1, 1993
22.938
+0.211
0.93%
jan 1, 1994
23.38
+0.442
1.93%
jan 1, 1995
23.179
-0.201
-0.86%
jan 1, 1996
22.443
-0.736
-3.18%
jan 1, 1997
21.806
-0.637
-2.84%
jan 1, 1998
21.893
+0.087
0.4%
jan 1, 1999
21.935
+0.042
0.19%
jan 1, 2000
22.27
+0.335
1.53%
jan 1, 2001
23.159
+0.889
3.99%
jan 1, 2002
23.014
-0.145
-0.63%
jan 1, 2003
23.108
+0.094
0.41%
jan 1, 2004
23.225
+0.116
0.5%
jan 1, 2005
22.887
-0.338
-1.46%
jan 1, 2006
22.976
+0.089
0.39%
jan 1, 2007
23.209
+0.233
1.02%
jan 1, 2008
23.259
+0.05
0.22%
jan 1, 2009
22.998
-0.261
-1.12%
jan 1, 2010
23.214
+0.216
0.94%
jan 1, 2011
23.385
+0.171
0.73%
jan 1, 2012
23.534
+0.149
0.64%
jan 1, 2013
22.778
-0.756
-3.21%
jan 1, 2014
23.67
+0.892
3.91%
jan 1, 2015
23.415
-0.255
-1.08%
Ranking of countries by current statistics by years


Comments: