29
/
en
AIzaSyAYiBZKx7MnpbEhh9jyipgxe19OcubqV5w
April 1, 2024
40297
IDA total
IDA
false
2
1
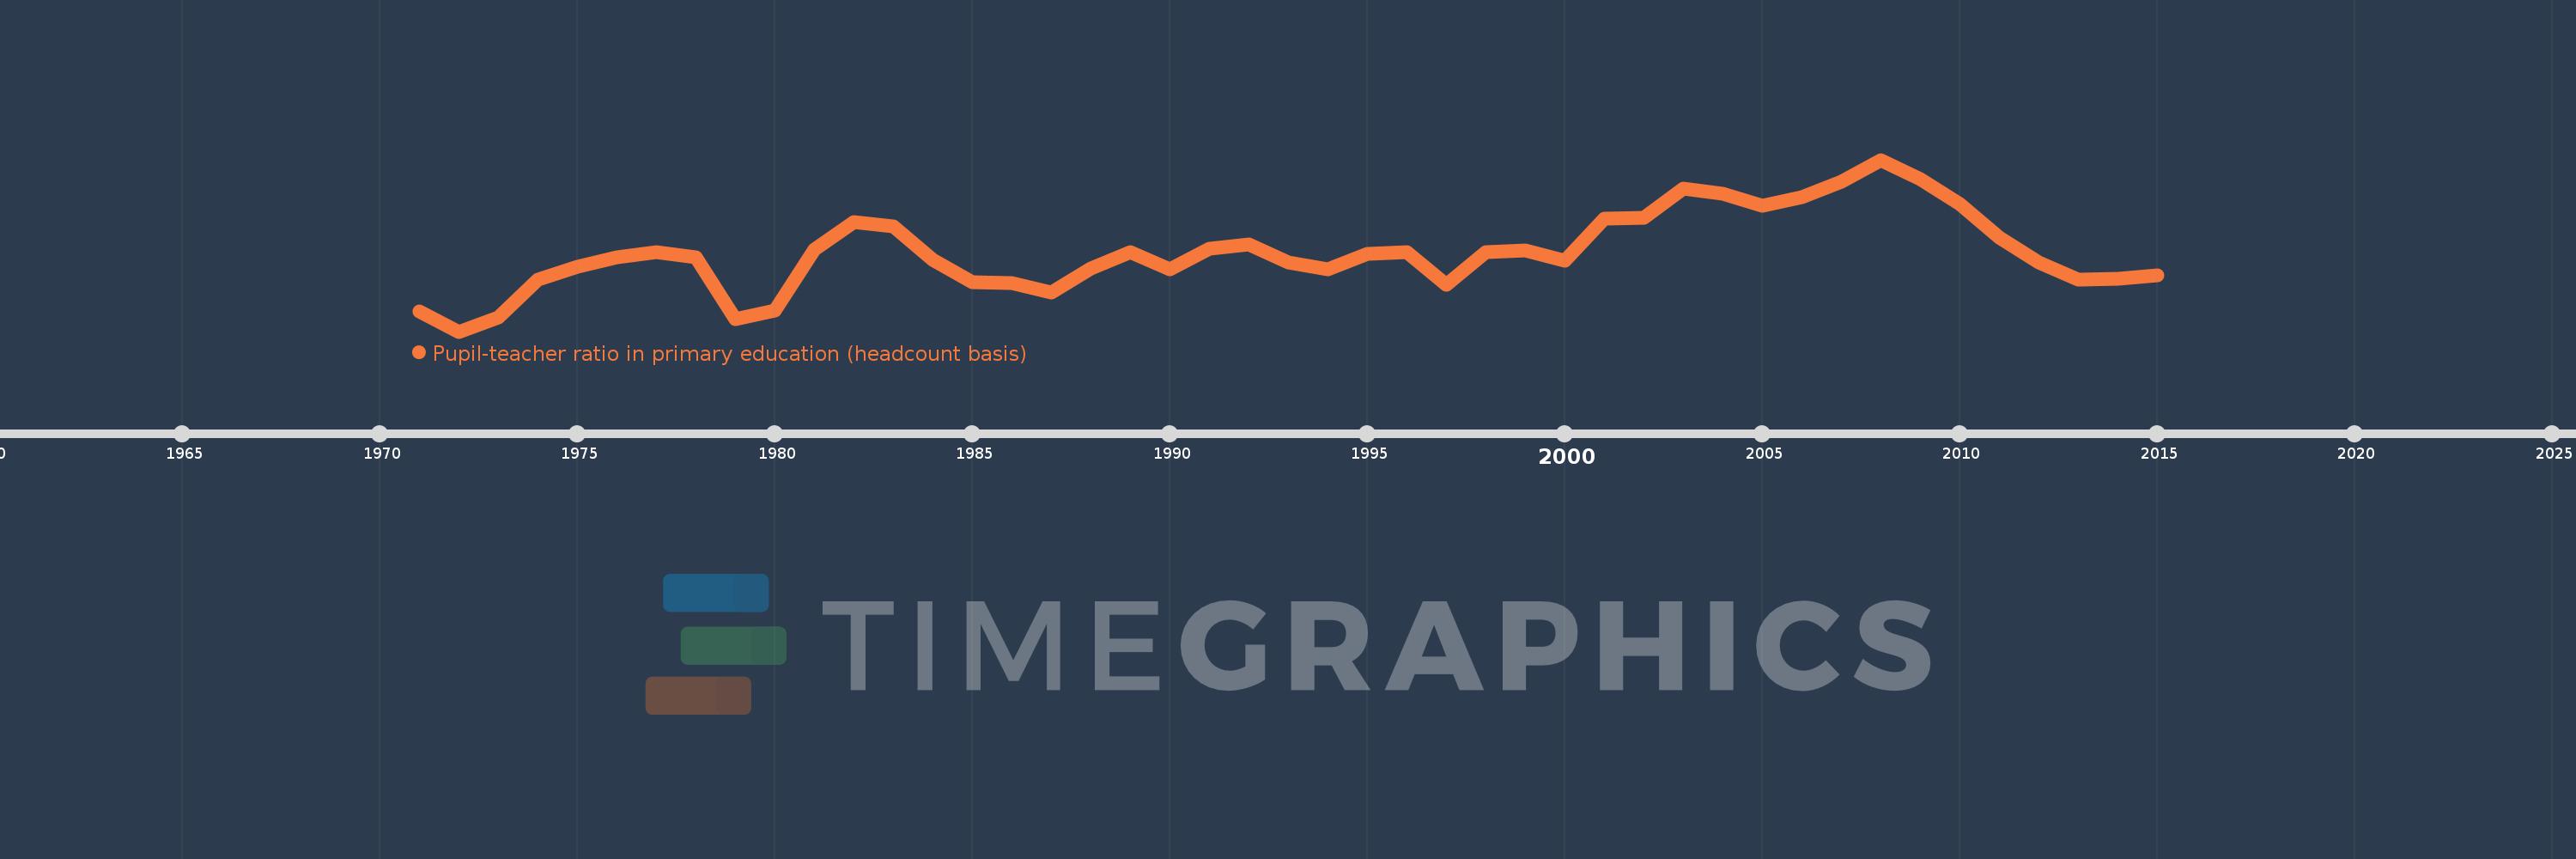
Pupil-teacher ratio in primary education (headcount basis)
2015,2014,2013,2012,2011,2010,2009,2008,2007,2006,2005,2004,2003,2002,2001,2000,1999,1998,1997,1996,1995,1994,1993,1992,1991,1990,1989,1988,1987,1986,1985,1984,1983,1982,1981,1980,1979,1978,1977,1976,1975,1974,1973,1972,1971
This statistics in other country:
AfghanistanAlbaniaAlgeriaAndorraAngolaAntigua and BarbudaArab WorldArgentinaArmeniaArubaAustraliaAustriaAzerbaijanBahamas, TheBahrainBangladeshBarbadosBelarusBelgiumBelizeBeninBermudaBhutanBoliviaBosnia and HerzegovinaBotswanaBrazilBritish Virgin IslandsBrunei DarussalamBulgariaBurkina FasoBurundiCabo VerdeCambodiaCameroonCanadaCaribbean small statesCayman IslandsCentral African RepublicCentral Europe and the BalticsChadChileChinaColombiaComorosCongo, Dem. Rep.Congo, Rep.Costa RicaCote d'IvoireCroatiaCubaCyprusCzech RepublicDenmarkDjiboutiDominicaDominican RepublicEarly-demographic dividendEast Asia & PacificEast Asia & Pacific (excluding high income)East Asia & Pacific (IDA & IBRD countries)EcuadorEgypt, Arab Rep.El SalvadorEquatorial GuineaEritreaEstoniaEthiopiaEuro areaEurope & Central AsiaEurope & Central Asia (excluding high income)Europe & Central Asia (IDA & IBRD countries)European UnionFijiFinlandFragile and conflict affected situationsFranceGabonGambia, TheGeorgiaGermanyGhanaGibraltarGreeceGrenadaGuatemalaGuineaGuinea-BissauGuyanaHaitiHeavily indebted poor countries (HIPC)High incomeHondurasHong Kong SAR, ChinaHungaryIBRD onlyIcelandIDA & IBRD totalIDA blendIDA onlyIDA totalIndiaIndonesiaIran, Islamic Rep.IraqIrelandIsraelItalyJamaicaJapanJordanKazakhstanKenyaKiribatiKorea, Dem. People’s Rep.Korea, Rep.KuwaitKyrgyz RepublicLao PDRLate-demographic dividendLatin America & Caribbean Latin America & Caribbean (excluding high income)Latin America & the Caribbean (IDA & IBRD countries)LatviaLeast developed countries: UN classificationLebanonLesothoLiberiaLibyaLiechtensteinLithuaniaLow & middle incomeLow incomeLower middle incomeLuxembourgMacao SAR, ChinaMacedonia, FYRMadagascarMalawiMalaysiaMaldivesMaliMaltaMarshall IslandsMauritaniaMauritiusMexicoMicronesia, Fed. Sts.Middle East & North AfricaMiddle East & North Africa (excluding high income)Middle East & North Africa (IDA & IBRD countries)Middle incomeMoldovaMonacoMongoliaMoroccoMozambiqueMyanmarNamibiaNauruNepalNetherlandsNew ZealandNicaraguaNigerNigeriaNorth AmericaNorwayOECD membersOmanOther small statesPacific island small statesPakistanPalauPanamaPapua New GuineaParaguayPeruPhilippinesPolandPortugalPost-demographic dividendPre-demographic dividendPuerto RicoQatarRomaniaRussian FederationRwandaSamoaSan MarinoSao Tome and PrincipeSaudi ArabiaSenegalSerbiaSeychellesSierra LeoneSingaporeSint Maarten (Dutch part)Slovak RepublicSloveniaSmall statesSolomon IslandsSomaliaSouth AfricaSouth AsiaSouth Asia (IDA & IBRD)South SudanSpainSri LankaSt. Kitts and NevisSt. LuciaSt. Vincent and the GrenadinesSub-Saharan Africa Sub-Saharan Africa (excluding high income)Sub-Saharan Africa (IDA & IBRD countries)SudanSurinameSwazilandSwedenSwitzerlandSyrian Arab RepublicTajikistanTanzaniaThailandTimor-LesteTogoTongaTrinidad and TobagoTunisiaTurkeyTurks and Caicos IslandsTuvaluUgandaUkraineUnited Arab EmiratesUnited KingdomUnited StatesUpper middle incomeUruguayUzbekistanVanuatuVenezuela, RBVietnamWest Bank and GazaWorldYemen, Rep.ZambiaZimbabwe Timeline:
This timeline shows a graph from 1971 to 2015 of IDA total. No data until 1970. Number of actual observations by date: 45.
Source name:
World Development Indicators
Source organization:
UNESCO Institute for Statistics
Categories, topics:
Education
Last updated:
apr 23, 2017
Indicators value changes by year
Minimum:
36.405
jan 1, 1972
Maximum:
40.091
jan 1, 2008
At the date of observation
Value
Absolute change
Change from previous value
jan 1, 1971
36.832
+36.832
0.0%
jan 1, 1972
36.405
-0.426
-1.16%
jan 1, 1973
36.715
+0.31
0.85%
jan 1, 1974
37.521
+0.806
2.2%
jan 1, 1975
37.79
+0.269
0.72%
jan 1, 1976
37.996
+0.205
0.54%
jan 1, 1977
38.105
+0.109
0.29%
jan 1, 1978
37.998
-0.107
-0.28%
jan 1, 1979
36.681
-1.317
-3.47%
jan 1, 1980
36.852
+0.172
0.47%
jan 1, 1981
38.169
+1.317
3.57%
jan 1, 1982
38.751
+0.582
1.52%
jan 1, 1983
38.661
-0.089
-0.23%
jan 1, 1984
37.939
-0.723
-1.87%
jan 1, 1985
37.467
-0.472
-1.24%
jan 1, 1986
37.452
-0.015
-0.04%
jan 1, 1987
37.239
-0.214
-0.57%
jan 1, 1988
37.752
+0.513
1.38%
jan 1, 1989
38.107
+0.355
0.94%
jan 1, 1990
37.745
-0.361
-0.95%
jan 1, 1991
38.192
+0.447
1.18%
jan 1, 1992
38.273
+0.081
0.21%
jan 1, 1993
37.897
-0.376
-0.98%
jan 1, 1994
37.746
-0.151
-0.4%
jan 1, 1995
38.079
+0.333
0.88%
jan 1, 1996
38.105
+0.026
0.07%
jan 1, 1997
37.407
-0.698
-1.83%
jan 1, 1998
38.105
+0.698
1.86%
jan 1, 1999
38.149
+0.044
0.12%
jan 1, 2000
37.918
-0.231
-0.6%
jan 1, 2001
38.824
+0.906
2.39%
jan 1, 2002
38.838
+0.014
0.04%
jan 1, 2003
39.473
+0.635
1.64%
jan 1, 2004
39.356
-0.117
-0.3%
jan 1, 2005
39.097
-0.259
-0.66%
jan 1, 2006
39.285
+0.188
0.48%
jan 1, 2007
39.621
+0.336
0.85%
jan 1, 2008
40.091
+0.47
1.19%
jan 1, 2009
39.683
-0.408
-1.02%
jan 1, 2010
39.136
-0.547
-1.38%
jan 1, 2011
38.423
-0.713
-1.82%
jan 1, 2012
37.895
-0.528
-1.37%
jan 1, 2013
37.515
-0.38
-1.0%
jan 1, 2014
37.544
+0.03
0.08%
jan 1, 2015
37.615
+0.071
0.19%
Ranking of countries by current statistics by years


Comments: