29
/
en
AIzaSyAYiBZKx7MnpbEhh9jyipgxe19OcubqV5w
April 1, 2024
120422
Djibouti
DJI
true
2
1
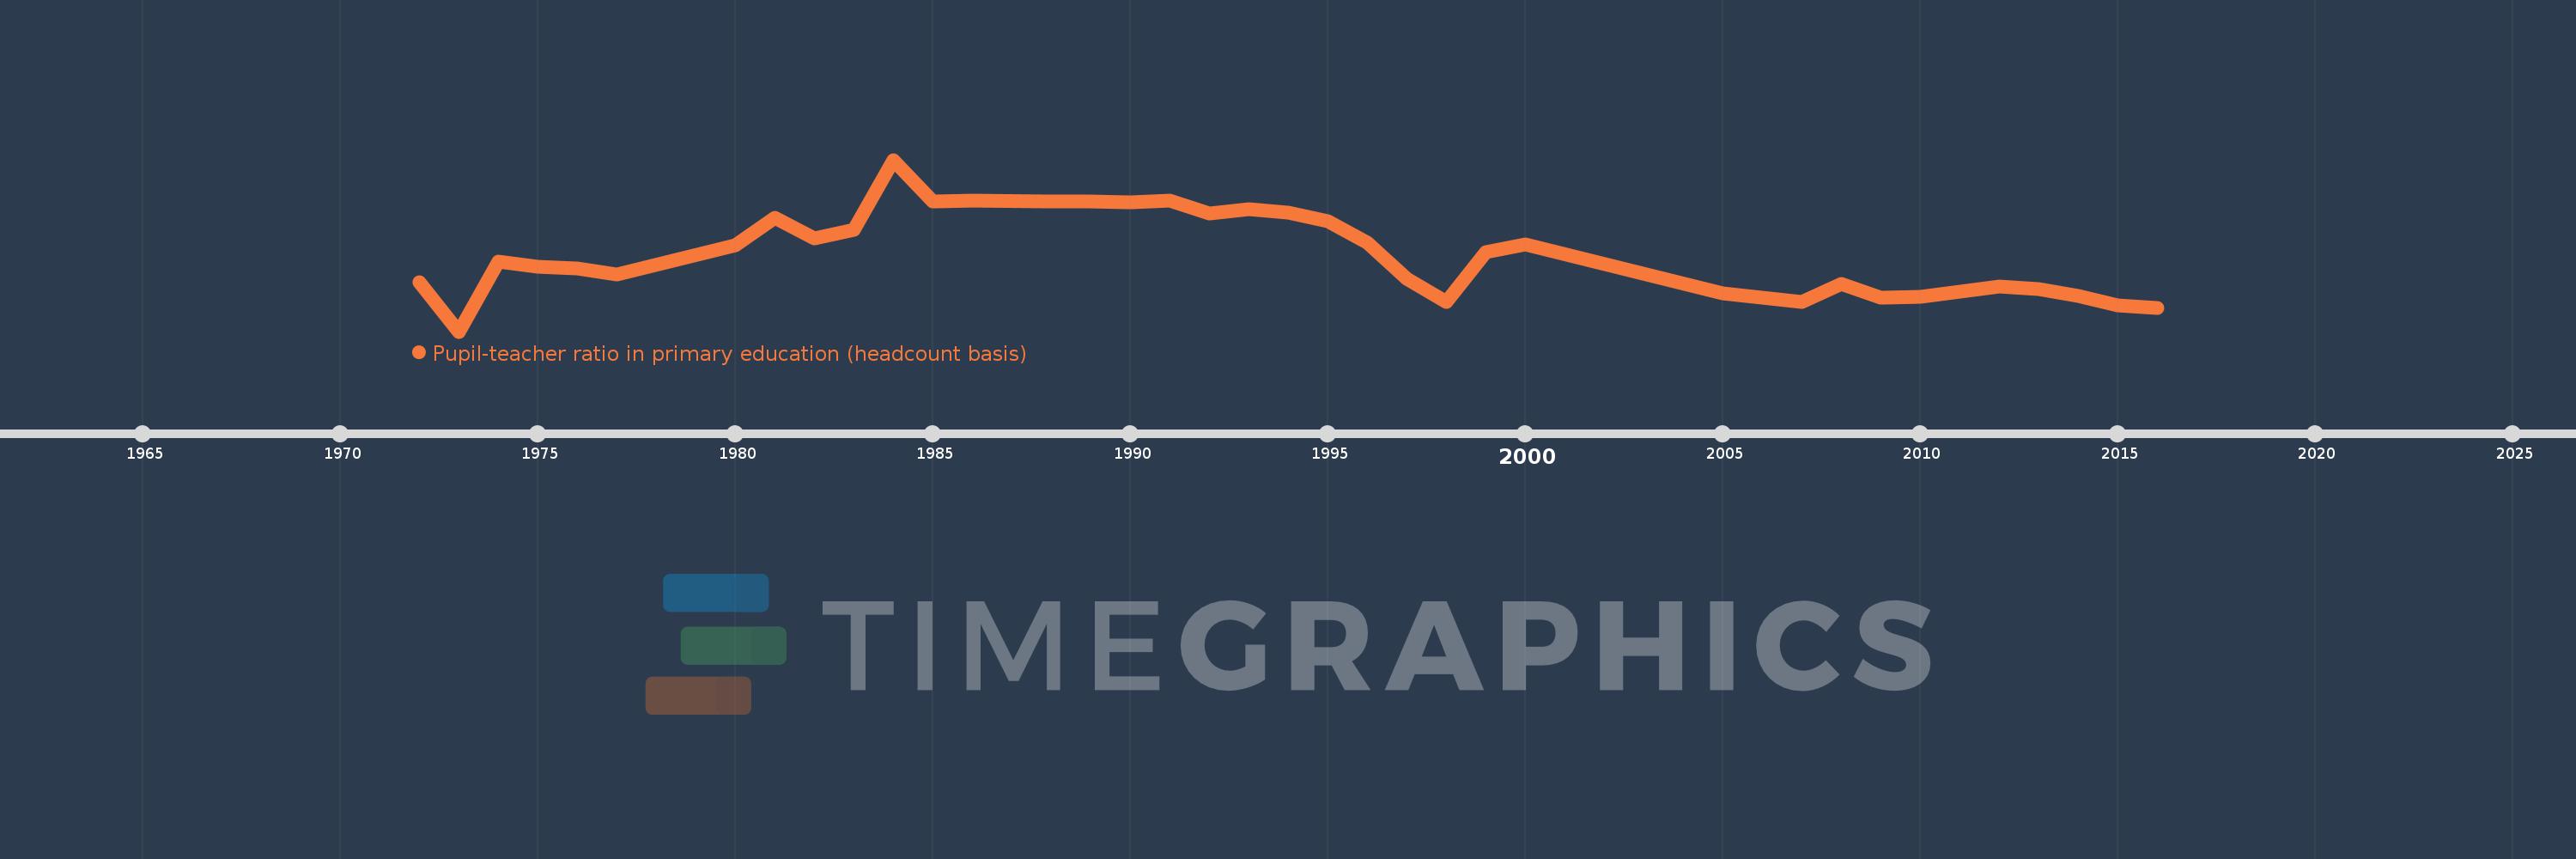
Pupil-teacher ratio in primary education (headcount basis)
2016,2015,2014,2013,2012,2010,2009,2008,2007,2005,2000,1999,1998,1997,1996,1995,1994,1993,1992,1991,1990,1989,1988,1986,1985,1984,1983,1982,1981,1980,1977,1976,1975,1974,1973,1972
This statistics in other country:
AfghanistanAlbaniaAlgeriaAndorraAngolaAntigua and BarbudaArab WorldArgentinaArmeniaArubaAustraliaAustriaAzerbaijanBahamas, TheBahrainBangladeshBarbadosBelarusBelgiumBelizeBeninBermudaBhutanBoliviaBosnia and HerzegovinaBotswanaBrazilBritish Virgin IslandsBrunei DarussalamBulgariaBurkina FasoBurundiCabo VerdeCambodiaCameroonCanadaCaribbean small statesCayman IslandsCentral African RepublicCentral Europe and the BalticsChadChileChinaColombiaComorosCongo, Dem. Rep.Congo, Rep.Costa RicaCote d'IvoireCroatiaCubaCyprusCzech RepublicDenmarkDjiboutiDominicaDominican RepublicEarly-demographic dividendEast Asia & PacificEast Asia & Pacific (excluding high income)East Asia & Pacific (IDA & IBRD countries)EcuadorEgypt, Arab Rep.El SalvadorEquatorial GuineaEritreaEstoniaEthiopiaEuro areaEurope & Central AsiaEurope & Central Asia (excluding high income)Europe & Central Asia (IDA & IBRD countries)European UnionFijiFinlandFragile and conflict affected situationsFranceGabonGambia, TheGeorgiaGermanyGhanaGibraltarGreeceGrenadaGuatemalaGuineaGuinea-BissauGuyanaHaitiHeavily indebted poor countries (HIPC)High incomeHondurasHong Kong SAR, ChinaHungaryIBRD onlyIcelandIDA & IBRD totalIDA blendIDA onlyIDA totalIndiaIndonesiaIran, Islamic Rep.IraqIrelandIsraelItalyJamaicaJapanJordanKazakhstanKenyaKiribatiKorea, Dem. People’s Rep.Korea, Rep.KuwaitKyrgyz RepublicLao PDRLate-demographic dividendLatin America & Caribbean Latin America & Caribbean (excluding high income)Latin America & the Caribbean (IDA & IBRD countries)LatviaLeast developed countries: UN classificationLebanonLesothoLiberiaLibyaLiechtensteinLithuaniaLow & middle incomeLow incomeLower middle incomeLuxembourgMacao SAR, ChinaMacedonia, FYRMadagascarMalawiMalaysiaMaldivesMaliMaltaMarshall IslandsMauritaniaMauritiusMexicoMicronesia, Fed. Sts.Middle East & North AfricaMiddle East & North Africa (excluding high income)Middle East & North Africa (IDA & IBRD countries)Middle incomeMoldovaMonacoMongoliaMoroccoMozambiqueMyanmarNamibiaNauruNepalNetherlandsNew ZealandNicaraguaNigerNigeriaNorth AmericaNorwayOECD membersOmanOther small statesPacific island small statesPakistanPalauPanamaPapua New GuineaParaguayPeruPhilippinesPolandPortugalPost-demographic dividendPre-demographic dividendPuerto RicoQatarRomaniaRussian FederationRwandaSamoaSan MarinoSao Tome and PrincipeSaudi ArabiaSenegalSerbiaSeychellesSierra LeoneSingaporeSint Maarten (Dutch part)Slovak RepublicSloveniaSmall statesSolomon IslandsSomaliaSouth AfricaSouth AsiaSouth Asia (IDA & IBRD)South SudanSpainSri LankaSt. Kitts and NevisSt. LuciaSt. Vincent and the GrenadinesSub-Saharan Africa Sub-Saharan Africa (excluding high income)Sub-Saharan Africa (IDA & IBRD countries)SudanSurinameSwazilandSwedenSwitzerlandSyrian Arab RepublicTajikistanTanzaniaThailandTimor-LesteTogoTongaTrinidad and TobagoTunisiaTurkeyTurks and Caicos IslandsTuvaluUgandaUkraineUnited Arab EmiratesUnited KingdomUnited StatesUpper middle incomeUruguayUzbekistanVanuatuVenezuela, RBVietnamWest Bank and GazaWorldYemen, Rep.ZambiaZimbabwe Timeline:
This timeline shows a graph from 1972 to 2016 of Djibouti. No data until 1971. Number of actual observations by date: 36.
Source name:
World Development Indicators
Source organization:
UNESCO Institute for Statistics
Categories, topics:
Education
Last updated:
apr 23, 2017
Indicators value changes by year
Minimum:
30.561
jan 1, 1973
Maximum:
48.305
jan 1, 1984
At the date of observation
Value
Absolute change
Change from previous value
jan 1, 1972
35.678
+35.678
0.0%
jan 1, 1973
30.561
-5.116
-14.34%
jan 1, 1974
37.772
+7.21
23.59%
jan 1, 1975
37.223
-0.549
-1.45%
jan 1, 1976
37.076
-0.147
-0.39%
jan 1, 1977
36.433
-0.643
-1.73%
jan 1, 1980
39.444
+3.011
8.27%
jan 1, 1981
42.297
+2.853
7.23%
jan 1, 1982
40.193
-2.104
-4.97%
jan 1, 1983
41.078
+0.885
2.2%
jan 1, 1984
48.305
+7.227
17.59%
jan 1, 1985
44.046
-4.259
-8.82%
jan 1, 1986
44.096
+0.05
0.11%
jan 1, 1988
43.981
-0.115
-0.26%
jan 1, 1989
44.037
+0.056
0.13%
jan 1, 1990
43.872
-0.165
-0.37%
jan 1, 1991
44.132
+0.26
0.59%
jan 1, 1992
42.73
-1.402
-3.18%
jan 1, 1993
43.239
+0.509
1.19%
jan 1, 1994
42.842
-0.398
-0.92%
jan 1, 1995
41.938
-0.904
-2.11%
jan 1, 1996
39.755
-2.183
-5.21%
jan 1, 1997
36.043
-3.712
-9.34%
jan 1, 1998
33.664
-2.379
-6.6%
jan 1, 1999
38.768
+5.103
15.16%
jan 1, 2000
39.538
+0.771
1.99%
jan 1, 2005
34.548
-4.99
-12.62%
jan 1, 2007
33.633
-0.916
-2.65%
jan 1, 2008
35.483
+1.851
5.5%
jan 1, 2009
34.034
-1.449
-4.08%
jan 1, 2010
34.14
+0.106
0.31%
jan 1, 2012
35.235
+1.095
3.21%
jan 1, 2013
34.932
-0.303
-0.86%
jan 1, 2014
34.216
-0.716
-2.05%
jan 1, 2015
33.24
-0.976
-2.85%
jan 1, 2016
33.022
-0.218
-0.66%
Ranking of countries by current statistics by years


Comments: