29
/
en
AIzaSyAYiBZKx7MnpbEhh9jyipgxe19OcubqV5w
April 1, 2024
151046
Honduras
HND
true
2
1
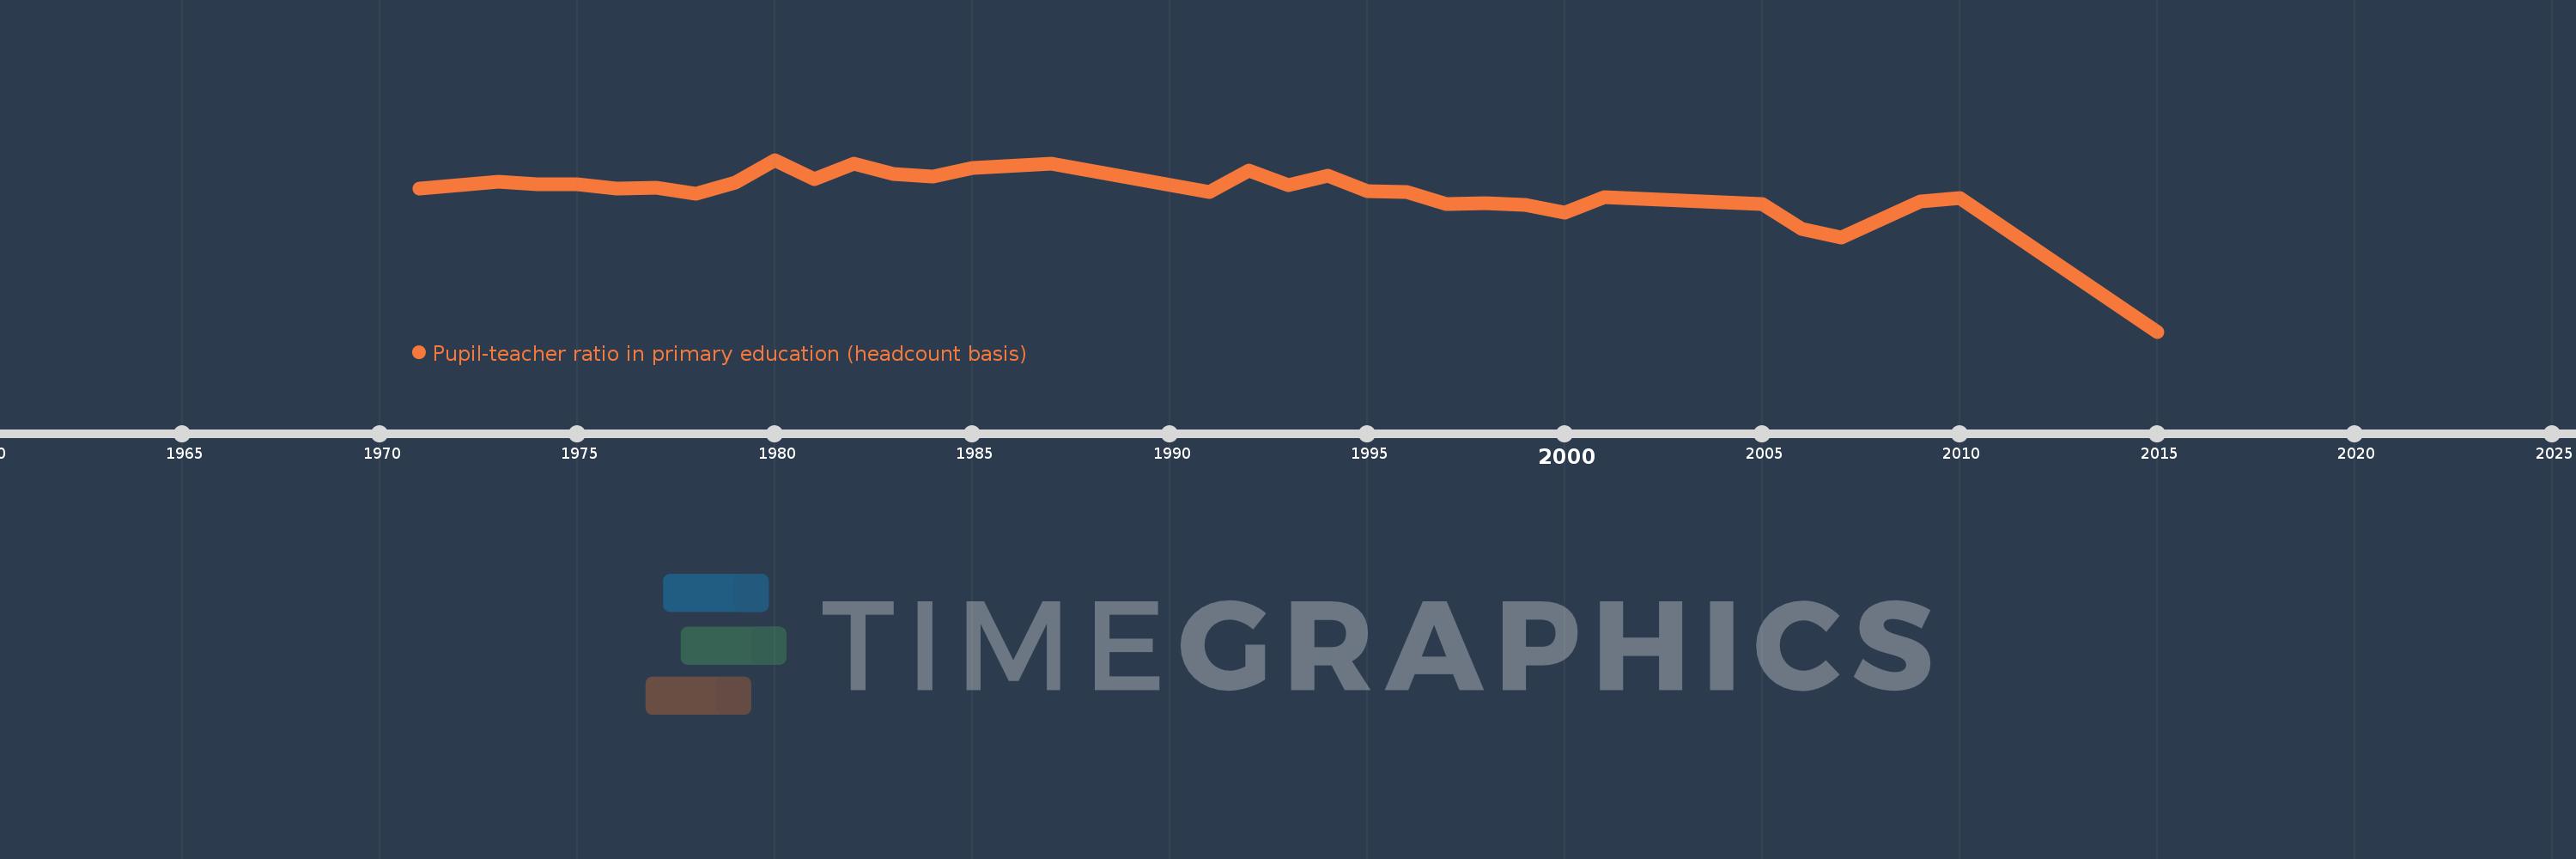
Pupil-teacher ratio in primary education (headcount basis)
2015,2010,2009,2007,2006,2005,2001,2000,1999,1998,1997,1996,1995,1994,1993,1992,1991,1987,1985,1984,1983,1982,1981,1980,1979,1978,1977,1976,1975,1974,1973,1972,1971
This statistics in other country:
AfghanistanAlbaniaAlgeriaAndorraAngolaAntigua and BarbudaArab WorldArgentinaArmeniaArubaAustraliaAustriaAzerbaijanBahamas, TheBahrainBangladeshBarbadosBelarusBelgiumBelizeBeninBermudaBhutanBoliviaBosnia and HerzegovinaBotswanaBrazilBritish Virgin IslandsBrunei DarussalamBulgariaBurkina FasoBurundiCabo VerdeCambodiaCameroonCanadaCaribbean small statesCayman IslandsCentral African RepublicCentral Europe and the BalticsChadChileChinaColombiaComorosCongo, Dem. Rep.Congo, Rep.Costa RicaCote d'IvoireCroatiaCubaCyprusCzech RepublicDenmarkDjiboutiDominicaDominican RepublicEarly-demographic dividendEast Asia & PacificEast Asia & Pacific (excluding high income)East Asia & Pacific (IDA & IBRD countries)EcuadorEgypt, Arab Rep.El SalvadorEquatorial GuineaEritreaEstoniaEthiopiaEuro areaEurope & Central AsiaEurope & Central Asia (excluding high income)Europe & Central Asia (IDA & IBRD countries)European UnionFijiFinlandFragile and conflict affected situationsFranceGabonGambia, TheGeorgiaGermanyGhanaGibraltarGreeceGrenadaGuatemalaGuineaGuinea-BissauGuyanaHaitiHeavily indebted poor countries (HIPC)High incomeHondurasHong Kong SAR, ChinaHungaryIBRD onlyIcelandIDA & IBRD totalIDA blendIDA onlyIDA totalIndiaIndonesiaIran, Islamic Rep.IraqIrelandIsraelItalyJamaicaJapanJordanKazakhstanKenyaKiribatiKorea, Dem. People’s Rep.Korea, Rep.KuwaitKyrgyz RepublicLao PDRLate-demographic dividendLatin America & Caribbean Latin America & Caribbean (excluding high income)Latin America & the Caribbean (IDA & IBRD countries)LatviaLeast developed countries: UN classificationLebanonLesothoLiberiaLibyaLiechtensteinLithuaniaLow & middle incomeLow incomeLower middle incomeLuxembourgMacao SAR, ChinaMacedonia, FYRMadagascarMalawiMalaysiaMaldivesMaliMaltaMarshall IslandsMauritaniaMauritiusMexicoMicronesia, Fed. Sts.Middle East & North AfricaMiddle East & North Africa (excluding high income)Middle East & North Africa (IDA & IBRD countries)Middle incomeMoldovaMonacoMongoliaMoroccoMozambiqueMyanmarNamibiaNauruNepalNetherlandsNew ZealandNicaraguaNigerNigeriaNorth AmericaNorwayOECD membersOmanOther small statesPacific island small statesPakistanPalauPanamaPapua New GuineaParaguayPeruPhilippinesPolandPortugalPost-demographic dividendPre-demographic dividendPuerto RicoQatarRomaniaRussian FederationRwandaSamoaSan MarinoSao Tome and PrincipeSaudi ArabiaSenegalSerbiaSeychellesSierra LeoneSingaporeSint Maarten (Dutch part)Slovak RepublicSloveniaSmall statesSolomon IslandsSomaliaSouth AfricaSouth AsiaSouth Asia (IDA & IBRD)South SudanSpainSri LankaSt. Kitts and NevisSt. LuciaSt. Vincent and the GrenadinesSub-Saharan Africa Sub-Saharan Africa (excluding high income)Sub-Saharan Africa (IDA & IBRD countries)SudanSurinameSwazilandSwedenSwitzerlandSyrian Arab RepublicTajikistanTanzaniaThailandTimor-LesteTogoTongaTrinidad and TobagoTunisiaTurkeyTurks and Caicos IslandsTuvaluUgandaUkraineUnited Arab EmiratesUnited KingdomUnited StatesUpper middle incomeUruguayUzbekistanVanuatuVenezuela, RBVietnamWest Bank and GazaWorldYemen, Rep.ZambiaZimbabwe Timeline:
This timeline shows a graph from 1971 to 2015 of Honduras. No data until 1970. Number of actual observations by date: 33.
Source name:
World Development Indicators
Source organization:
UNESCO Institute for Statistics
Categories, topics:
Education
Last updated:
apr 23, 2017
Indicators value changes by year
Minimum:
13.671
jan 1, 2015
At the date of observation
Value
Absolute change
Change from previous value
jan 1, 1971
35.289
+35.289
0.0%
jan 1, 1972
35.837
+0.548
1.55%
jan 1, 1973
36.291
+0.454
1.27%
jan 1, 1974
35.922
-0.37
-1.02%
jan 1, 1975
35.983
+0.062
0.17%
jan 1, 1976
35.32
-0.664
-1.84%
jan 1, 1977
35.403
+0.083
0.23%
jan 1, 1978
34.542
-0.861
-2.43%
jan 1, 1979
36.24
+1.698
4.92%
jan 1, 1980
39.66
+3.42
9.44%
jan 1, 1981
36.7
-2.96
-7.46%
jan 1, 1982
39.025
+2.325
6.33%
jan 1, 1983
37.467
-1.558
-3.99%
jan 1, 1984
37.098
-0.369
-0.98%
jan 1, 1985
38.47
+1.372
3.7%
jan 1, 1987
39.09
+0.619
1.61%
jan 1, 1991
34.823
-4.267
-10.92%
jan 1, 1992
38.055
+3.232
9.28%
jan 1, 1993
35.887
-2.168
-5.7%
jan 1, 1994
37.286
+1.399
3.9%
jan 1, 1995
34.9
-2.386
-6.4%
jan 1, 1996
34.788
-0.111
-0.32%
jan 1, 1997
32.951
-1.837
-5.28%
jan 1, 1998
33.135
+0.184
0.56%
jan 1, 1999
32.829
-0.306
-0.92%
jan 1, 2000
31.726
-1.104
-3.36%
jan 1, 2001
34.059
+2.333
7.35%
jan 1, 2005
32.905
-1.154
-3.39%
jan 1, 2006
29.142
-3.763
-11.44%
jan 1, 2007
27.929
-1.213
-4.16%
jan 1, 2009
33.344
+5.415
19.39%
jan 1, 2010
33.876
+0.533
1.6%
jan 1, 2015
13.671
-20.205
-59.64%
Ranking of countries by current statistics by years


Comments: