29
/
en
AIzaSyAYiBZKx7MnpbEhh9jyipgxe19OcubqV5w
April 1, 2024
42946
Latin America & Caribbean (excluding high income)
LAC
false
2
1
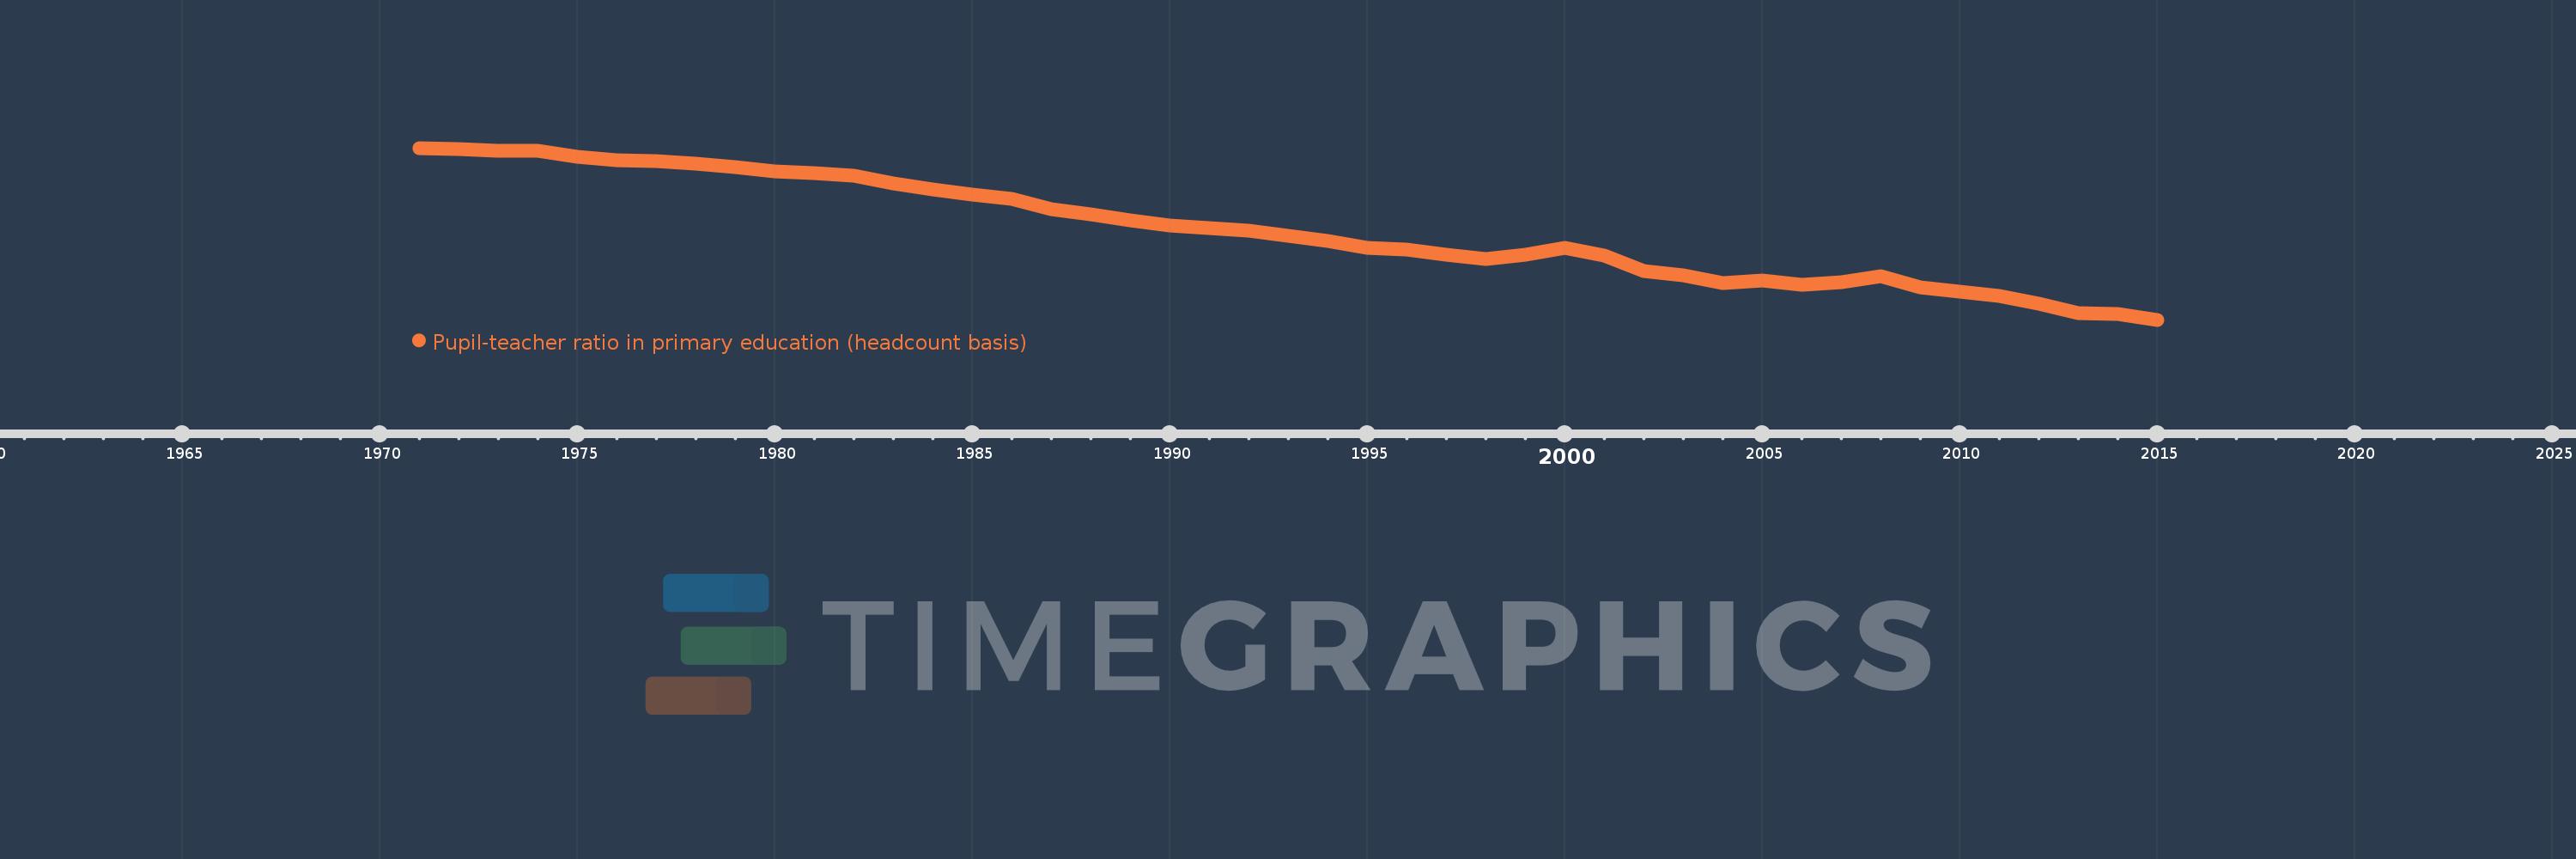
Pupil-teacher ratio in primary education (headcount basis)
2015,2014,2013,2012,2011,2010,2009,2008,2007,2006,2005,2004,2003,2002,2001,2000,1999,1998,1997,1996,1995,1994,1993,1992,1991,1990,1989,1988,1987,1986,1985,1984,1983,1982,1981,1980,1979,1978,1977,1976,1975,1974,1973,1972,1971
This statistics in other country:
AfghanistanAlbaniaAlgeriaAndorraAngolaAntigua and BarbudaArab WorldArgentinaArmeniaArubaAustraliaAustriaAzerbaijanBahamas, TheBahrainBangladeshBarbadosBelarusBelgiumBelizeBeninBermudaBhutanBoliviaBosnia and HerzegovinaBotswanaBrazilBritish Virgin IslandsBrunei DarussalamBulgariaBurkina FasoBurundiCabo VerdeCambodiaCameroonCanadaCaribbean small statesCayman IslandsCentral African RepublicCentral Europe and the BalticsChadChileChinaColombiaComorosCongo, Dem. Rep.Congo, Rep.Costa RicaCote d'IvoireCroatiaCubaCyprusCzech RepublicDenmarkDjiboutiDominicaDominican RepublicEarly-demographic dividendEast Asia & PacificEast Asia & Pacific (excluding high income)East Asia & Pacific (IDA & IBRD countries)EcuadorEgypt, Arab Rep.El SalvadorEquatorial GuineaEritreaEstoniaEthiopiaEuro areaEurope & Central AsiaEurope & Central Asia (excluding high income)Europe & Central Asia (IDA & IBRD countries)European UnionFijiFinlandFragile and conflict affected situationsFranceGabonGambia, TheGeorgiaGermanyGhanaGibraltarGreeceGrenadaGuatemalaGuineaGuinea-BissauGuyanaHaitiHeavily indebted poor countries (HIPC)High incomeHondurasHong Kong SAR, ChinaHungaryIBRD onlyIcelandIDA & IBRD totalIDA blendIDA onlyIDA totalIndiaIndonesiaIran, Islamic Rep.IraqIrelandIsraelItalyJamaicaJapanJordanKazakhstanKenyaKiribatiKorea, Dem. People’s Rep.Korea, Rep.KuwaitKyrgyz RepublicLao PDRLate-demographic dividendLatin America & Caribbean Latin America & Caribbean (excluding high income)Latin America & the Caribbean (IDA & IBRD countries)LatviaLeast developed countries: UN classificationLebanonLesothoLiberiaLibyaLiechtensteinLithuaniaLow & middle incomeLow incomeLower middle incomeLuxembourgMacao SAR, ChinaMacedonia, FYRMadagascarMalawiMalaysiaMaldivesMaliMaltaMarshall IslandsMauritaniaMauritiusMexicoMicronesia, Fed. Sts.Middle East & North AfricaMiddle East & North Africa (excluding high income)Middle East & North Africa (IDA & IBRD countries)Middle incomeMoldovaMonacoMongoliaMoroccoMozambiqueMyanmarNamibiaNauruNepalNetherlandsNew ZealandNicaraguaNigerNigeriaNorth AmericaNorwayOECD membersOmanOther small statesPacific island small statesPakistanPalauPanamaPapua New GuineaParaguayPeruPhilippinesPolandPortugalPost-demographic dividendPre-demographic dividendPuerto RicoQatarRomaniaRussian FederationRwandaSamoaSan MarinoSao Tome and PrincipeSaudi ArabiaSenegalSerbiaSeychellesSierra LeoneSingaporeSint Maarten (Dutch part)Slovak RepublicSloveniaSmall statesSolomon IslandsSomaliaSouth AfricaSouth AsiaSouth Asia (IDA & IBRD)South SudanSpainSri LankaSt. Kitts and NevisSt. LuciaSt. Vincent and the GrenadinesSub-Saharan Africa Sub-Saharan Africa (excluding high income)Sub-Saharan Africa (IDA & IBRD countries)SudanSurinameSwazilandSwedenSwitzerlandSyrian Arab RepublicTajikistanTanzaniaThailandTimor-LesteTogoTongaTrinidad and TobagoTunisiaTurkeyTurks and Caicos IslandsTuvaluUgandaUkraineUnited Arab EmiratesUnited KingdomUnited StatesUpper middle incomeUruguayUzbekistanVanuatuVenezuela, RBVietnamWest Bank and GazaWorldYemen, Rep.ZambiaZimbabwe Timeline:
This timeline shows a graph from 1971 to 2015 of Latin America & Caribbean (excluding high income). No data until 1970. Number of actual observations by date: 45.
Source name:
World Development Indicators
Source organization:
UNESCO Institute for Statistics
Categories, topics:
Education
Last updated:
apr 23, 2017
Indicators value changes by year
Minimum:
21.666
jan 1, 2015
Maximum:
31.975
jan 1, 1971
At the date of observation
Value
Absolute change
Change from previous value
jan 1, 1971
31.975
+31.975
0.0%
jan 1, 1972
31.901
-0.075
-0.23%
jan 1, 1973
31.816
-0.085
-0.27%
jan 1, 1974
31.786
-0.029
-0.09%
jan 1, 1975
31.454
-0.332
-1.04%
jan 1, 1976
31.252
-0.203
-0.64%
jan 1, 1977
31.193
-0.059
-0.19%
jan 1, 1978
31.043
-0.149
-0.48%
jan 1, 1979
30.851
-0.192
-0.62%
jan 1, 1980
30.58
-0.271
-0.88%
jan 1, 1981
30.46
-0.12
-0.39%
jan 1, 1982
30.291
-0.169
-0.55%
jan 1, 1983
29.839
-0.452
-1.49%
jan 1, 1984
29.489
-0.35
-1.17%
jan 1, 1985
29.193
-0.297
-1.01%
jan 1, 1986
28.908
-0.284
-0.97%
jan 1, 1987
28.275
-0.634
-2.19%
jan 1, 1988
28.004
-0.271
-0.96%
jan 1, 1989
27.635
-0.369
-1.32%
jan 1, 1990
27.296
-0.339
-1.22%
jan 1, 1991
27.175
-0.121
-0.44%
jan 1, 1992
27.035
-0.14
-0.51%
jan 1, 1993
26.719
-0.316
-1.17%
jan 1, 1994
26.396
-0.324
-1.21%
jan 1, 1995
25.983
-0.412
-1.56%
jan 1, 1996
25.861
-0.122
-0.47%
jan 1, 1997
25.546
-0.315
-1.22%
jan 1, 1998
25.294
-0.252
-0.99%
jan 1, 1999
25.589
+0.295
1.16%
jan 1, 2000
25.968
+0.38
1.48%
jan 1, 2001
25.537
-0.432
-1.66%
jan 1, 2002
24.605
-0.932
-3.65%
jan 1, 2003
24.354
-0.251
-1.02%
jan 1, 2004
23.878
-0.476
-1.96%
jan 1, 2005
24.041
+0.163
0.68%
jan 1, 2006
23.762
-0.279
-1.16%
jan 1, 2007
23.929
+0.168
0.71%
jan 1, 2008
24.281
+0.352
1.47%
jan 1, 2009
23.609
-0.672
-2.77%
jan 1, 2010
23.337
-0.273
-1.16%
jan 1, 2011
23.08
-0.257
-1.1%
jan 1, 2012
22.651
-0.429
-1.86%
jan 1, 2013
22.053
-0.598
-2.64%
jan 1, 2014
22.029
-0.024
-0.11%
jan 1, 2015
21.666
-0.364
-1.65%
Ranking of countries by current statistics by years


Comments: