29
/
en
AIzaSyAYiBZKx7MnpbEhh9jyipgxe19OcubqV5w
April 1, 2024
58488
South Asia (IDA & IBRD)
TSA
false
2
1
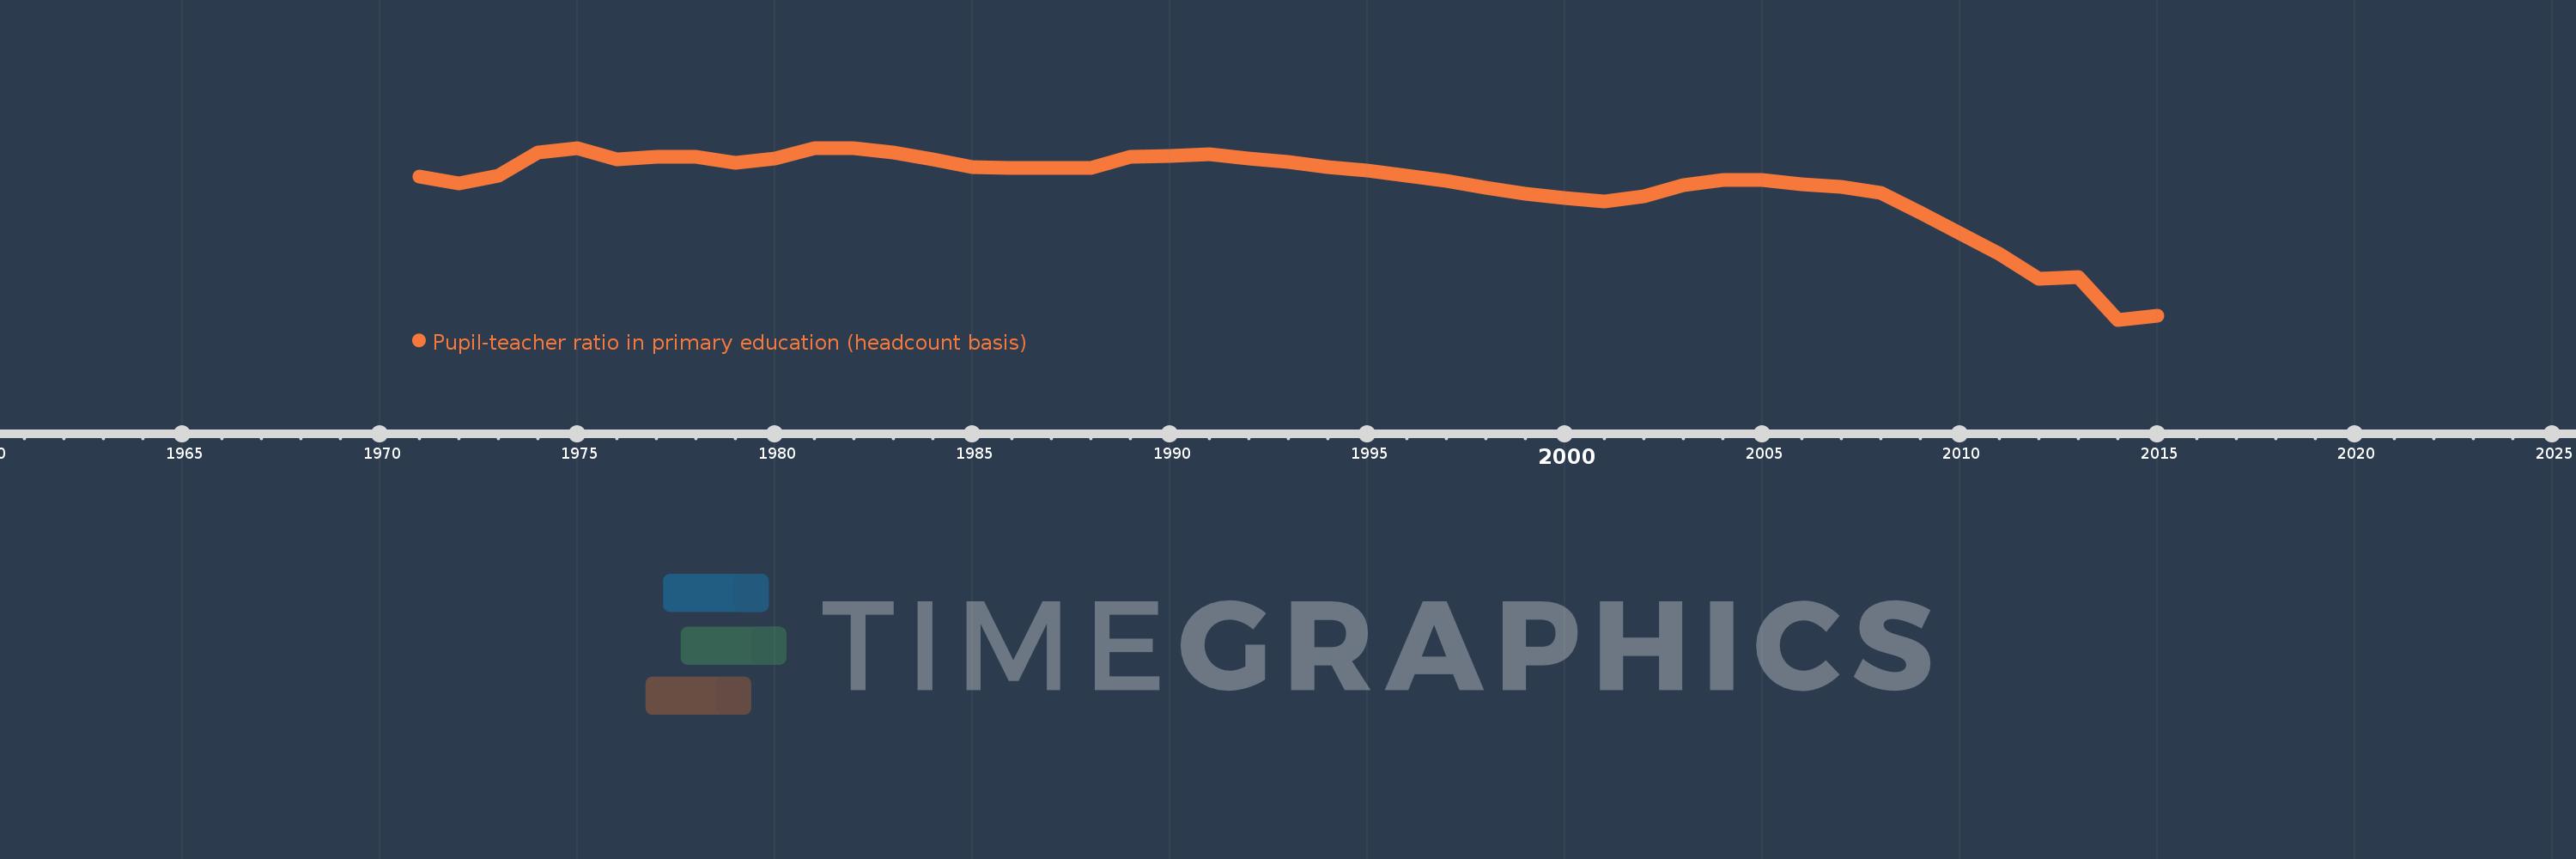
Pupil-teacher ratio in primary education (headcount basis)
2015,2014,2013,2012,2011,2010,2009,2008,2007,2006,2005,2004,2003,2002,2001,2000,1999,1998,1997,1996,1995,1994,1993,1992,1991,1990,1989,1988,1987,1986,1985,1984,1983,1982,1981,1980,1979,1978,1977,1976,1975,1974,1973,1972,1971
This statistics in other country:
AfghanistanAlbaniaAlgeriaAndorraAngolaAntigua and BarbudaArab WorldArgentinaArmeniaArubaAustraliaAustriaAzerbaijanBahamas, TheBahrainBangladeshBarbadosBelarusBelgiumBelizeBeninBermudaBhutanBoliviaBosnia and HerzegovinaBotswanaBrazilBritish Virgin IslandsBrunei DarussalamBulgariaBurkina FasoBurundiCabo VerdeCambodiaCameroonCanadaCaribbean small statesCayman IslandsCentral African RepublicCentral Europe and the BalticsChadChileChinaColombiaComorosCongo, Dem. Rep.Congo, Rep.Costa RicaCote d'IvoireCroatiaCubaCyprusCzech RepublicDenmarkDjiboutiDominicaDominican RepublicEarly-demographic dividendEast Asia & PacificEast Asia & Pacific (excluding high income)East Asia & Pacific (IDA & IBRD countries)EcuadorEgypt, Arab Rep.El SalvadorEquatorial GuineaEritreaEstoniaEthiopiaEuro areaEurope & Central AsiaEurope & Central Asia (excluding high income)Europe & Central Asia (IDA & IBRD countries)European UnionFijiFinlandFragile and conflict affected situationsFranceGabonGambia, TheGeorgiaGermanyGhanaGibraltarGreeceGrenadaGuatemalaGuineaGuinea-BissauGuyanaHaitiHeavily indebted poor countries (HIPC)High incomeHondurasHong Kong SAR, ChinaHungaryIBRD onlyIcelandIDA & IBRD totalIDA blendIDA onlyIDA totalIndiaIndonesiaIran, Islamic Rep.IraqIrelandIsraelItalyJamaicaJapanJordanKazakhstanKenyaKiribatiKorea, Dem. People’s Rep.Korea, Rep.KuwaitKyrgyz RepublicLao PDRLate-demographic dividendLatin America & Caribbean Latin America & Caribbean (excluding high income)Latin America & the Caribbean (IDA & IBRD countries)LatviaLeast developed countries: UN classificationLebanonLesothoLiberiaLibyaLiechtensteinLithuaniaLow & middle incomeLow incomeLower middle incomeLuxembourgMacao SAR, ChinaMacedonia, FYRMadagascarMalawiMalaysiaMaldivesMaliMaltaMarshall IslandsMauritaniaMauritiusMexicoMicronesia, Fed. Sts.Middle East & North AfricaMiddle East & North Africa (excluding high income)Middle East & North Africa (IDA & IBRD countries)Middle incomeMoldovaMonacoMongoliaMoroccoMozambiqueMyanmarNamibiaNauruNepalNetherlandsNew ZealandNicaraguaNigerNigeriaNorth AmericaNorwayOECD membersOmanOther small statesPacific island small statesPakistanPalauPanamaPapua New GuineaParaguayPeruPhilippinesPolandPortugalPost-demographic dividendPre-demographic dividendPuerto RicoQatarRomaniaRussian FederationRwandaSamoaSan MarinoSao Tome and PrincipeSaudi ArabiaSenegalSerbiaSeychellesSierra LeoneSingaporeSint Maarten (Dutch part)Slovak RepublicSloveniaSmall statesSolomon IslandsSomaliaSouth AfricaSouth AsiaSouth Asia (IDA & IBRD)South SudanSpainSri LankaSt. Kitts and NevisSt. LuciaSt. Vincent and the GrenadinesSub-Saharan Africa Sub-Saharan Africa (excluding high income)Sub-Saharan Africa (IDA & IBRD countries)SudanSurinameSwazilandSwedenSwitzerlandSyrian Arab RepublicTajikistanTanzaniaThailandTimor-LesteTogoTongaTrinidad and TobagoTunisiaTurkeyTurks and Caicos IslandsTuvaluUgandaUkraineUnited Arab EmiratesUnited KingdomUnited StatesUpper middle incomeUruguayUzbekistanVanuatuVenezuela, RBVietnamWest Bank and GazaWorldYemen, Rep.ZambiaZimbabwe Timeline:
This timeline shows a graph from 1971 to 2015 of South Asia (IDA & IBRD). No data until 1970. Number of actual observations by date: 45.
Source name:
World Development Indicators
Source organization:
UNESCO Institute for Statistics
Categories, topics:
Education
Last updated:
apr 23, 2017
Indicators value changes by year
Minimum:
33.696
jan 1, 2014
Maximum:
42.676
jan 1, 1982
At the date of observation
Value
Absolute change
Change from previous value
jan 1, 1971
41.178
+41.178
0.0%
jan 1, 1972
40.823
-0.355
-0.86%
jan 1, 1973
41.245
+0.422
1.03%
jan 1, 1974
42.456
+1.211
2.94%
jan 1, 1975
42.65
+0.194
0.46%
jan 1, 1976
42.099
-0.551
-1.29%
jan 1, 1977
42.208
+0.109
0.26%
jan 1, 1978
42.232
+0.024
0.06%
jan 1, 1979
41.918
-0.314
-0.74%
jan 1, 1980
42.123
+0.205
0.49%
jan 1, 1981
42.646
+0.523
1.24%
jan 1, 1982
42.676
+0.03
0.07%
jan 1, 1983
42.436
-0.24
-0.56%
jan 1, 1984
42.058
-0.378
-0.89%
jan 1, 1985
41.656
-0.403
-0.96%
jan 1, 1986
41.617
-0.039
-0.09%
jan 1, 1987
41.621
+0.004
0.01%
jan 1, 1988
41.628
+0.007
0.02%
jan 1, 1989
42.23
+0.602
1.45%
jan 1, 1990
42.262
+0.032
0.08%
jan 1, 1991
42.35
+0.088
0.21%
jan 1, 1992
42.136
-0.214
-0.5%
jan 1, 1993
41.935
-0.202
-0.48%
jan 1, 1994
41.691
-0.243
-0.58%
jan 1, 1995
41.503
-0.188
-0.45%
jan 1, 1996
41.243
-0.26
-0.63%
jan 1, 1997
40.939
-0.305
-0.74%
jan 1, 1998
40.603
-0.335
-0.82%
jan 1, 1999
40.285
-0.319
-0.78%
jan 1, 2000
40.038
-0.247
-0.61%
jan 1, 2001
39.88
-0.158
-0.4%
jan 1, 2002
40.159
+0.279
0.7%
jan 1, 2003
40.739
+0.58
1.44%
jan 1, 2004
41.015
+0.276
0.68%
jan 1, 2005
40.994
-0.021
-0.05%
jan 1, 2006
40.78
-0.213
-0.52%
jan 1, 2007
40.63
-0.151
-0.37%
jan 1, 2008
40.325
-0.305
-0.75%
jan 1, 2009
39.31
-1.015
-2.52%
jan 1, 2010
38.232
-1.078
-2.74%
jan 1, 2011
37.152
-1.079
-2.82%
jan 1, 2012
35.849
-1.303
-3.51%
jan 1, 2013
35.92
+0.071
0.2%
jan 1, 2014
33.696
-2.224
-6.19%
jan 1, 2015
33.914
+0.219
0.65%
Ranking of countries by current statistics by years


Comments: